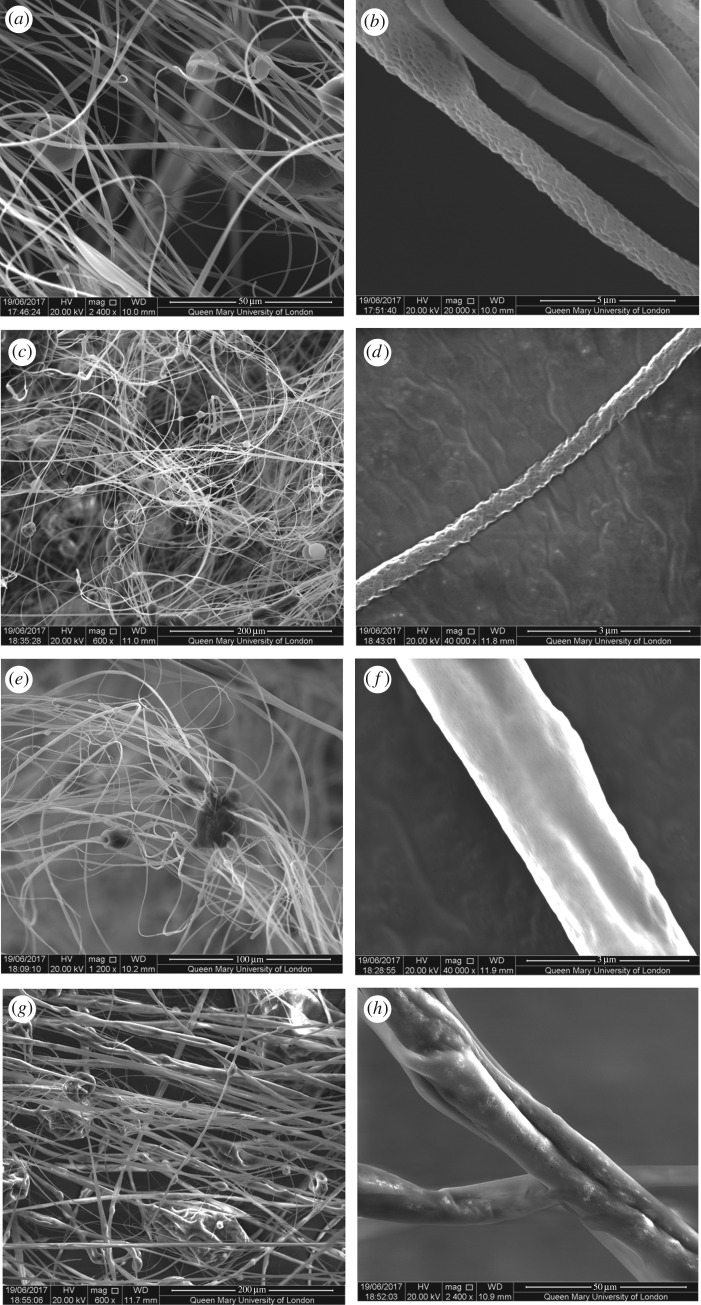
Figure 3.
SEM images of the fibres formed using pressurized gyration at 0.2 MPa and 36 000 r.p.m. (a) Low magnification SEM image demonstrating fibre morphology of pure PMMA fibres (scale bar = 50 µm); (b) high-magnification SEM image illustrating pore morphology of pure PMMA fibres (scale bar = 5 µm); (c) low-magnification SEM image of 2 wt% GNP-loaded PMMA fibres (scale bar = 200 µm); (d) high-magnification SEM image of 2 wt% GNP-loaded PMMA fibres (scale bar = 3 µm); (e) low-magnification SEM image of 4 wt% GNP-loaded PMMA fibres (scale bar = 100 µm); (f) high-magnification SEM image illustrating surface topography of 4 wt% GNP-loaded PMMA fibres (scale bar = 3 µm); (g) low-magnification SEM image of 8 wt% GNP-loaded PMMA fibres (scale bar = 200 µm); (h) high-magnification SEM image of 8 wt% GNP-loaded PMMA fibres (scale bar = 50 µm).

