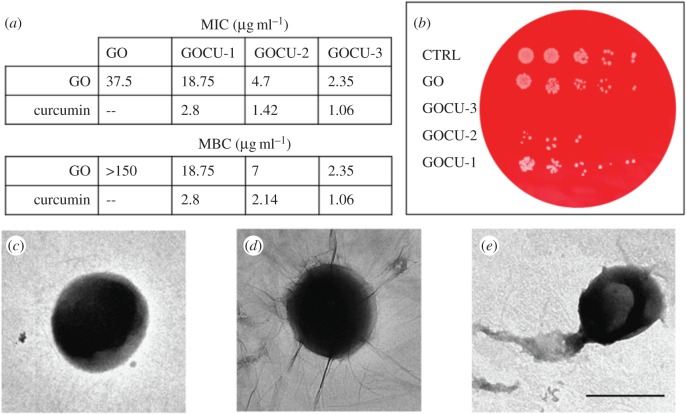
Figure 3.
Antibacterial activity of GO and GOCU against MRSA (a) MIC and MBC values for each sample, GO and curcumin concentration measured are reported. (b) Exemplary plate obtained after treatment of MRSA with a GO concentration of 4.7 µg ml−1 in GO, GOCU-1, GOCU-2 and GOCU-3. TEM images of control (c), MRSA treated with GO (d) and MRSA treated with GOCU-2. (Online version in colour.)

