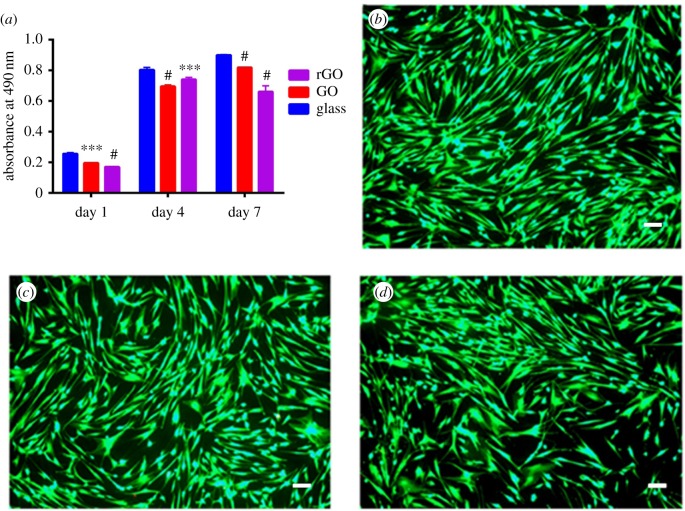
Figure 2.
(a) MTS proliferation assay of dASCs grown on rGO (purple), GO (red) and glass (blue) substrates at day 1, at day 4 and day 7 time-points; #p < 0.0001, ***p < 0.001, **p < 0.01, *p < 0.05; (b–d) dASCs after 48 h of cellular growth on glass, GO and rGO, respectively. Calcein AM-positive cells are alive cells and they are visible in the image due to green fluorescence. 99.89 ± 0.01% of cells on GO substrates, 99.80 ± 0.02% of cells rGO coverslips and 99.87 ± 0.02% of cells on glass substrates were alive. Scale bar, 100 µm.

