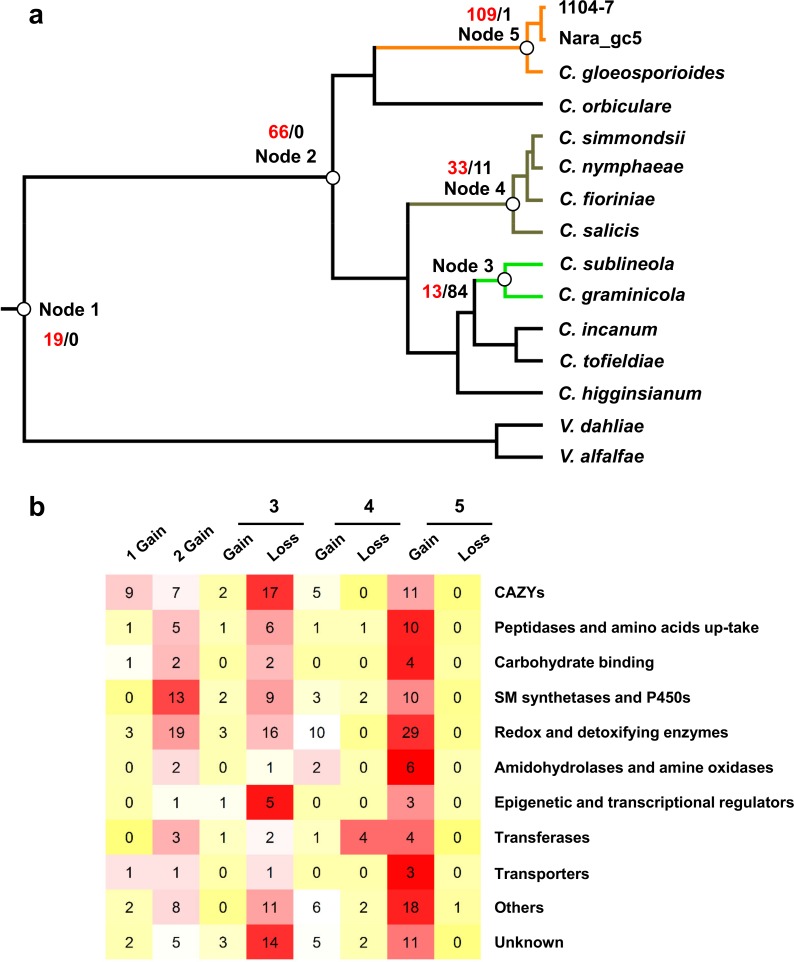
Fig 3. Gene gain and loss patterns at major five nodes of the Colletotrichum phylogeny.
(a) Number of families significantly expanded (red) or contracted (CAFE analysis, family P < 0.01, Viterbi P < 0.05). (b) Functional categories of the families significantly expanded or contracted at indicated nodes.

