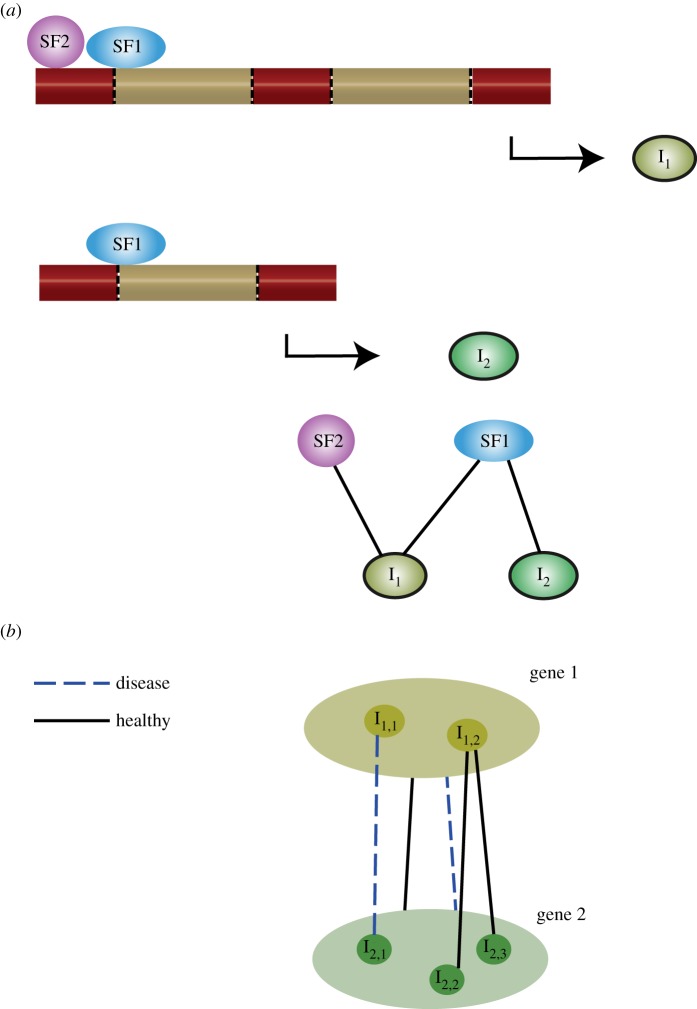
Figure 3.
(a) Two different isoforms are shown. Isoform 1 (I1) is regulated by two splicing factors (SF1 and SF2). By contrast, isoform 2 (I2) is only regulated by SF1. The network view of this relationship is shown underneath. (b) This example shows a toy network between two genes and their isoforms. At the gene level, a connection between the two genes is shown under both healthy and disease states. However, at the isoform level, differences can be seen in the interaction between isoforms in the healthy and disease states.

