Figure 4.
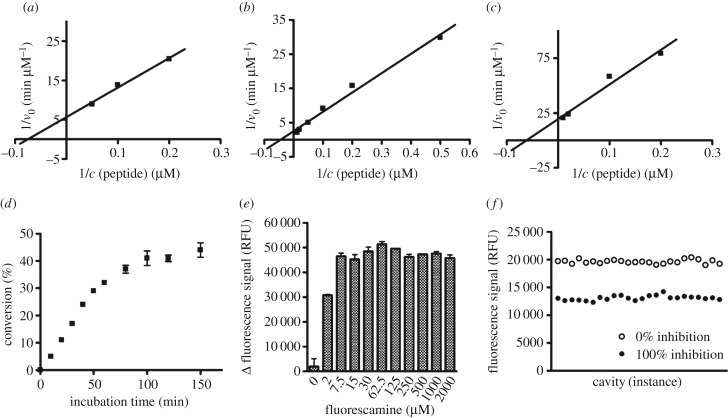
Set-up of the fluorescamine-based activity assay (FA-assay). (a) Determination of Km value of α-tubulin-myr-peptide on Sirt2 (13.4 µM) by linearization of the Michaelis–Menten plot in a double reciprocal diagram. (b) Determination of Km value of α-tubulin-ac-peptide on Sirt3 (22.2 µM) by linearization of the Michaelis–Menten plot in a double reciprocal diagram. (c) Determination of Km value of α-tubulin-myr-peptide on Sirt3 (16.1 µM) by linearization of the Michaelis–Menten plot in a double reciprocal diagram. (d) Time course of Sirt2-catalysed deacetylation (0–150 min). (e) Effect on signal window of final assay concentration of fluorescamine in a range from 0 to 2000 µM, dissolved in acetone. (f) Determination of Z-factor (0.65) of deacetylation by Sirt2; 24-fold determination of 100% inhibition and 0% inhibition. (Δ fluorescence signal: fluorescence signal of 100% conversion minus 100% inhibition.) v0, velocity; c, concentration; RFU, relative fluorescence units.

