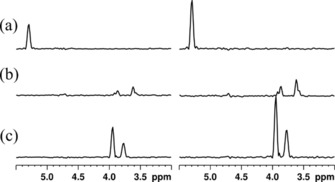
Figure 4.

1H cross sections from ctsnHMQC spectra obtained from the same raw data as Figure 3 b. Traces on the left are processed without DBU, whereas traces on the right are processed using DBU. Traces (a) were taken from the corresponding 2 D spectra at 61.4 ppm, trace (b) at 71.5 ppm, and trace (c) at 92.2 ppm as indicated in Figure 3 b.
