Figure 4.

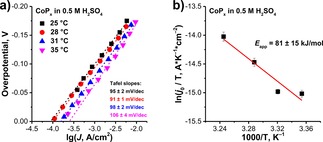
T‐dependent Tafel plots and b) corresponding Arrhenius plot of HER conducted on CoPx in 0.5 M H2SO4 with intermittent cathodic protection.

T‐dependent Tafel plots and b) corresponding Arrhenius plot of HER conducted on CoPx in 0.5 M H2SO4 with intermittent cathodic protection.