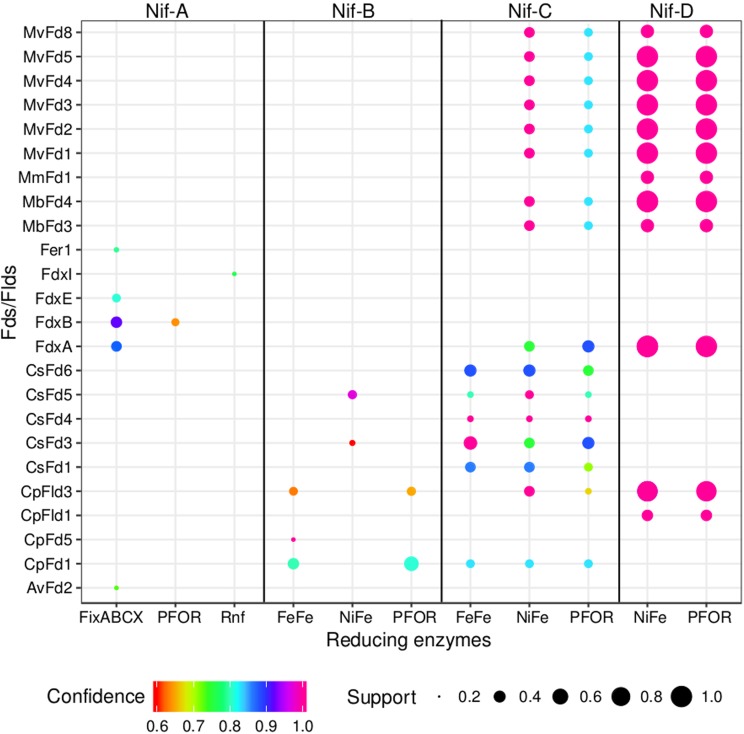
FIG 4.
Bubble plot depicting the dominant patterns in the distribution of putative electron carrier protein homologs (Fds/Flds), enzyme homologs that putatively reduce Fd/Fld, and specified Nif lineages, as determined by the Apriori algorithm (124). Each unique pattern is given as a bubble, and the color represents the confidence value, or statistical significance, in the codistribution of specified proteins (only confidence values of ≥0.6 are presented). The size of the bubble represents the support value (≥0.2), or the frequency with which two proteins are identified in the same genome. For simplicity, only the proteins that were present in >20% of the diazotrophic genomes for each specified nitrogenase lineage were considered in this analysis. PFOR, pyruvate-Fld oxidoreductase; Rnf, Rhodobacter nitrogen fixation protein; FeFe, iron-only hydrogenase; NiFe, nickel-iron hydrogenase; FixABCX, electron transfer flavoprotein that is involved in nitrogen fixation. Names of source organisms for Fds and Flds are abbreviated as follows: Mv, Methanocaldococcus vulcanius; Mm, Methanococcus maripaludis; Mb, Methanosarcina barkeri; Cs, Caldicellulosiruptor saccharolyticus; Cp, Clostridium pasteurianum; Av, A. vinelandii. Abbreviations for Fds and Flds are presented in Tables 1 and 2, respectively.

