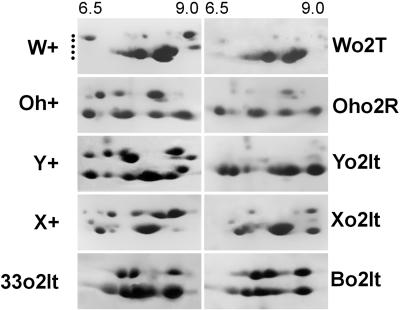
Figure 2.
Two-dimensional (2D) gel analysis of zein protein extracts. Approximately 100 μg of zein protein extracts was loaded for each genotype. In the first dimension (IEF), the equilibrium pH gradient from left to right was between 6.5 and 9.0 as reported at the top and this applies for all the panels. Genotypes, abbreviated as reported in Table I, are indicated at the left or at the right of each panel. Dots on the left identify the five major size classes of zeins.

