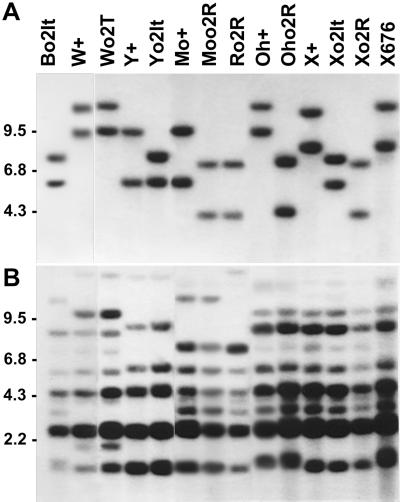
Figure 3.
Southern analysis of genomic DNA from different maize lines digested with EcoRI and probed with O2 cDNA (A) and with the heavy chain zein cDNA M1 (B). Maize lines, abbreviated as in Table I, are reported on the top and apply for both panels. Molecular mass markers in kb are on the left. Approximately 10 μg of DNA was digested to completion as described by Bianchi and Viotti (1988) and applied in each lane.

