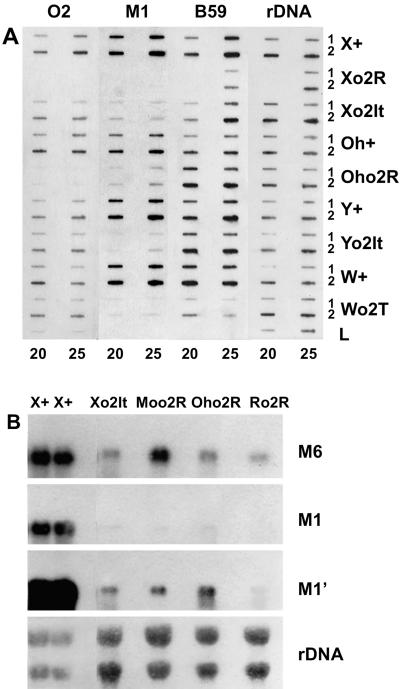
Figure 4.
A, Slot-blot analysis of total RNAs of maize genotypes as reported on the right. RNA was isolated from endosperms at 20 and 25 DAP, as indicated at the bottom. For each genotype and DAP, 1 and 2 μg loads were analyzed as indicated on the right. The total RNA at 20 DAP from the Xo2R line was not available in our stock of frozen seeds. Lane L contains total RNA from maize leaf in 1- and 2-μg horizontal loads from left to right, respectively. Probes are reported at the top of each strip. The filter was subjected to a series of sequential hybridization-stripping cycles using the probes indicated from left to right. B, Northern analysis of total RNA from endosperms of maize lines as indicated at the top. The wild-type RNA from endosperms at 20 and 25 DAP from left to right was 5 μg for each load and the o2 RNAs (20 DAP) were 10 μg for each load. Probes are indicated at the right of each panel. M1′ shows a longer exposure than M1. The filter was subjected to a series of sequential hybridizations to the four probes (from top to bottom) and stripping. Exposure time, at −80°C with intensifying screens, was 6 d for O2 and 5 h for zein probes. rDNA blots were exposed for 1 h at room temperature.

