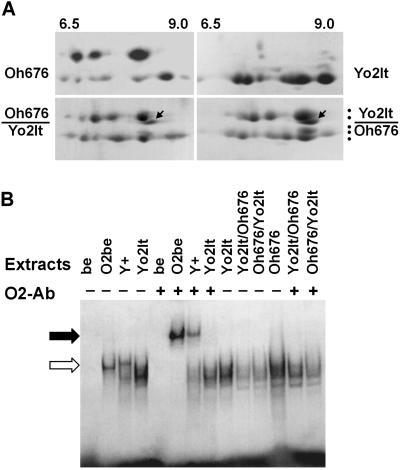
Figure 5.
A, 2D analysis of zein extracts from the Yo2It and Oh676 lines and from their reciprocal crosses as indicated at the side of each panel. The pH gradient (from 6.5–9.0) is indicated at the top and applies for all the panels. Dots indicate the five major size classes. Arrow indicates the zein spot expressed in the reciprocals. B, EMSAs of double strand oligonucleotide containing the O2-binding site. Protein extracts from endosperms and bacterial protein extracts from E. coli, expressing (O2be) or nonexpressing (be) the O2 polypeptide, were used in this analysis. Wild-type and o2 maize lines or o2 hybrids are indicated at the top of each lane. Addition (+) of O2-antiserum (O2-Ab) is indicated. Open arrow indicates the migration of the oligonucleotide bands shifted by O2 protein in O2be and Y+. Closed arrow indicates the super-shift determined by the addition of O2-antiserum to the mixture.

