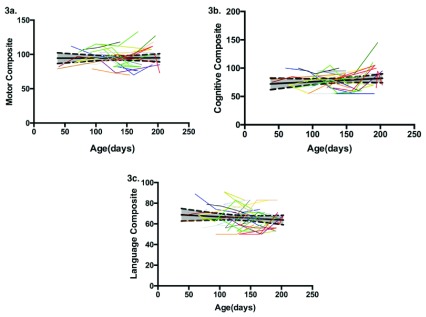
Figure 3. Bayley Scales of Infant Development scores by chronological age.
Each colored line represents a different infant across repeated assessments. Single dots represent the two infants who were assessed only once each. The solid black line is the mean, the dashed black line is 1 standard deviation. ( A) Motor composite. ( B) Cognitive composite. ( C) Language composite.

