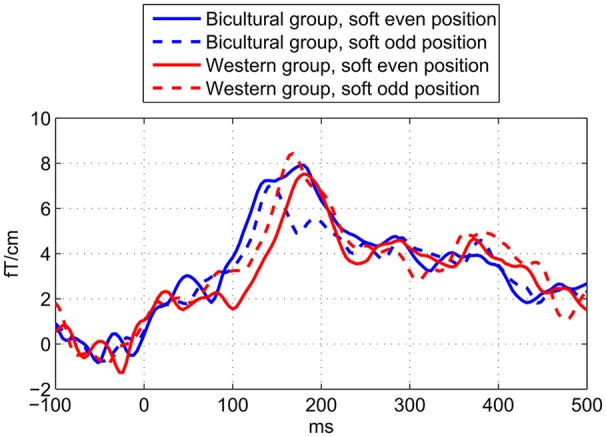
Figure 5.

Waveforms showing enculturation effects on metric deviant MMNm. Showing the MMNm difference waveforms for the cultural groups and metric deviant positions. The MMNm amplitude in the Western group (red) is significantly stronger to the odd deviants (dashed line) than even deviants (solid line), but not in the Bicultural group (blue). Also, the latency of the MMNm is significantly shorter in the Bicultural group (blue) compared to the Western group (red). The horizontal axis shows the latency in ms. The vertical axis shows the average amplitude of the evoked magnetic field in femto-Tesla per centimeter (fT/cm) measured across the applied eight sensors above the left and right hemisphere.
