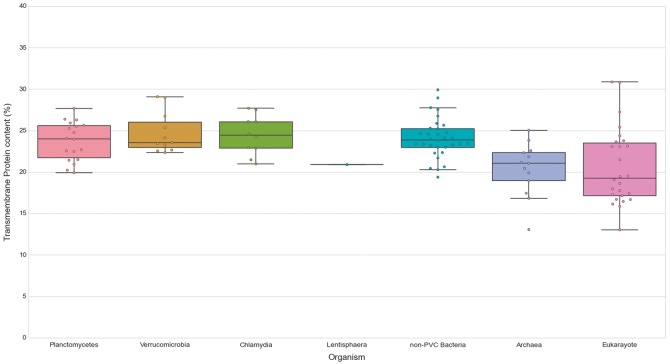
Figure 7.
Transmembrane proteins in PVC and representative species from the tree of life. The numbers of TMHs containing proteins, expressed as percentages of the proteomes. Box plots reflect the distribution of the data. The box encloses the quartiles of the dataset, while the whiskers extend to the limits of the distributions. Outliers are determined based on the interquartile range and are not included in the boxes. The middle horizontal line in the box marks the median of the distribution.

