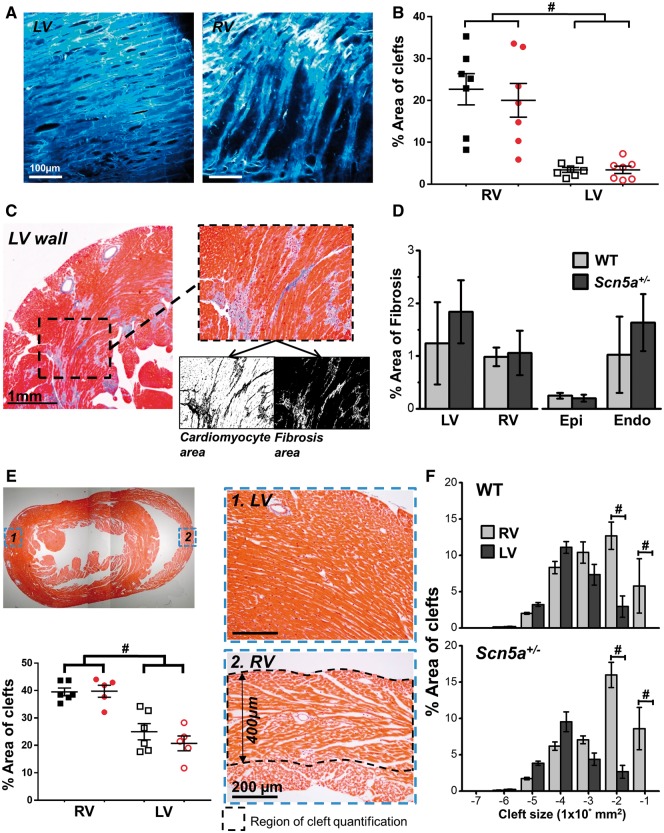
Figure 4.
Transmural structural features in mouse LV and RV. (A) Example images of cardiomyocyte density from 2 P imaging of LV (left) and RV (right) sub-epicardium (z-100 μm). (B) Quantification of non-vascular clefts from 2 P images, in WT (black squares, n = 7) and Scn5a+/− (red circles, n = 7) hearts. (C) Fibrosis quantification from histological section stained with Masson’s trichrome. Fibrosis is shown in blue. Black and white images below inset image show quantification of cardiomyocyte (left) and fibrosis (right) area using thresholding in ImageJ. (D) Left panel—% area of fibrosis from the transmural wall for both LV and RV. Right panel—% area of fibrosis measured from the LV sub-epicardium (from surface to deepest scan depth using 2P microscope) and the midmyocardium to sub-endocardium (portion of ventricle not scanned using two-photon). A total of eight serial sections were quantified for each heart and a single mean value obtained from these values. (E) Top left image shows a histological section stained with Masson’s trichrome, images on right indicate typical sections from 1. LV and 2. RV transmural wall. Absolute depth of quantification for both LV and RV is indicated in 2. Bottom left panel indicates quantification of non-vascular clefts in both ventricles from histological sections of WT (black squares, n = 6) and Scn5a+/− (red circles, n = 5) hearts. (F) Comparison of graded cleft sizes as a percentage of total cleft area between RV (light grey) and LV (dark grey). Top panel; WT mouse hearts (n = 6), bottom panel; Scn5a+/− mouse hearts (n = 5). Panels B, E, and F, #P < 0.01, RV vs. LV. Two-way ANOVA with Bonferroni multiple comparisons test.

