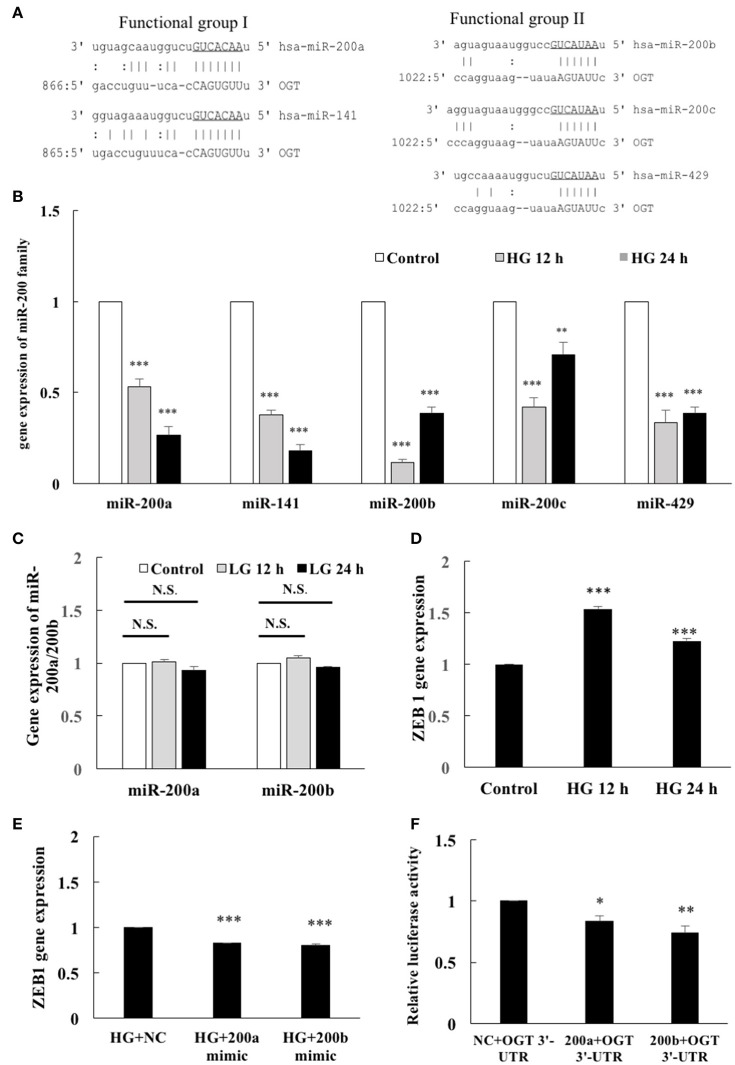
Figure 2.
OGT is a direct target of miR-200a and miR-200b. (A) Bioinformatics miR target analysis identified homologies between miR-200a, miR-141, miR-200b, miR-200c, miR-429, and the 3′-UTR of human OGT mRNA, indicating potential regulation of OGT by these miRs. | AU or CG.: GU wobble. (B) Real-time PCR showed that HG stimulation for 12 h decreased miR-200a, miR-141, miR-200b, miR-200c, and miR-429 expression levels to 53, 38, 11, 42, and 33% of the control level, respectively. Similarly, 24 h HG stimulation decreased miR-200a, miR-141, miR-200b, miR-200c, and miR-429 expression levels to 27, 18, 39, 71, and 39% of the control level, respectively N = 5. **p < 0.01 and ***p < 0.001 compared with control. miR expression levels were normalized to U6 expression. (C) LG did not modulate miR-200a/200b expression levels N = 4. N.S. not significant. (D) HAECs were stimulated with HG (25 mM) for 12 and 24 h. Real-time PCR demonstrates that stimulation of HAECs with HG induced 1.53-fold (12 h) and 1.23-fold (24 h) increases in ZEB1 mRNA levels N = 5. ***p < 0.001 compared with control. (E) miR-200a/200b mimic transfection inhibited HG-induced endothelial ZEB1 mRNA expression to 83 and 80% of the control level, respectively, in the HG-stimulated HAECs N = 4. ***p < 0.001 compared with the HG-treated HAECs transfected with a negative control (HG+NC). (F) A luciferase reporter assay showed that cotransfection of pmirGLO-OGT-3′-UTR and the miR-200a/200b mimics downregulated the luciferase signal to 83 and 74%, respectively, of the control luciferase signal, respectively N = 5. *p < 0.05 and **p < 0.01 compared with the negative control.

