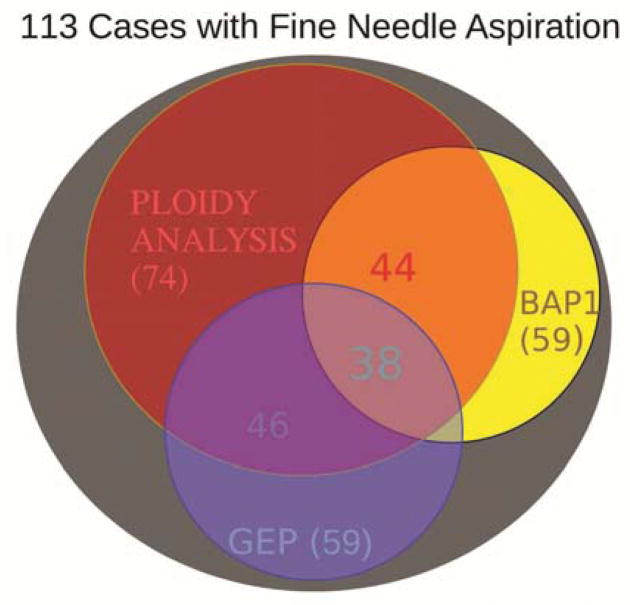
Figure 1.
Venn diagram of overlap of prognostic characteristics to predict prognosis from fine needle aspirates of uveal melanomas. The number of cases available in each prognostic category are shown by the numbers in parentheses. The numbers without parentheses are those in the overlapped categories available for correlative analysis. These numbers are color coded to show the areas involved, e.g. (purple=red+blue).

