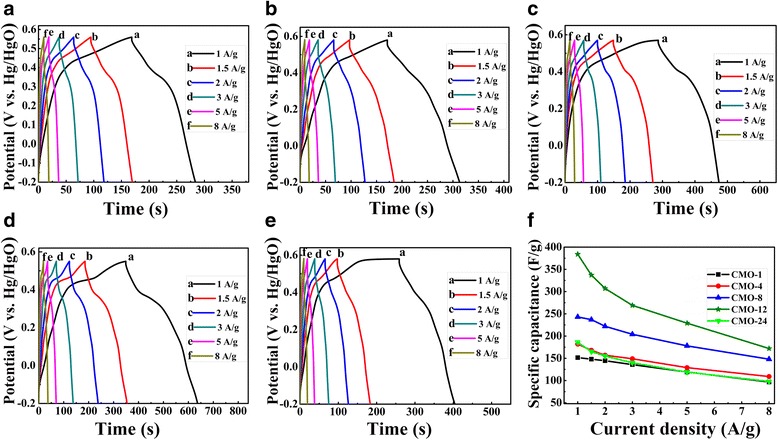
Fig. 6.

The GCD curves under different current densities of 1, 1.5, 2, 3, 5, and 8 A g−1 of samples a CMO-1, b CMO-4, c CMO-8, d CMO-12, and e CMO-24 in the potential window ranged from − 0.2 to + 0.58 V. f The specific capacitance of samples calculated by GCD results
