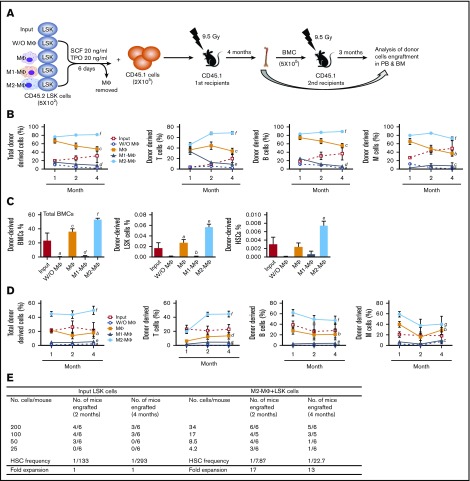
Figure 2.
CRA and serial BM transplantation confirm the differential effects of M1-MΦs and M2-MΦs on HSC self-renewal and expansion in vitro. (A) Diagram illustrating the experimental design for LSK cell coculture with MΦs, M1-MΦs, and M2-MΦs or without MΦs (W/O MΦ) for CRA and serial BM transplantation. (B) Donor-derived total nucleate cells, T cells, B cells, and myeloid cells (M cells) in the peripheral blood of the primary recipients 1, 2, and 4 months after transplantation. All data are mean ± SEM (n = 5 recipients for input and MΦs, n = 6 recipients for W/O MΦs, and n = 8 recipients for M1-MΦs and M2-MΦ). aP < .05 vs Input, bP < 0.05 vs W/O MΦ, cP < .05 vs Input and W/O MΦ, dP < .05 vs Input and MΦ, eP < .05 vs W/O MΦ and MΦ, fP < .05 vs all other groups, 2-way ANOVA. (C) Donor-derived total BM nucleate cells (BMCs), LSK cells, and HSCs (CD150+CD48− LSK cells) in BM of the primary recipients 4 months after transplantation. Data are mean ± SEM (n = 5-8 recipients per group, as described in panel B). aP < .05 vs Input, bP < .05 vs MΦ, cP < .05 vs Input and W/O MΦ, dP < .05 vs Input and MΦ, eP < .05 vs all other groups, fP < .05 vs all other groups except MΦ (1-way ANOVA). (D) Donor-derived total nucleate cells, T cells, B cells, and myeloid cells (M cells) in the peripheral blood of the secondary recipients 1, 2, and 3 months after transplantation. Data are mean ± SEM (n = 6 recipients for input and W/O MΦ, n = 5 recipients for MΦs, and n = 7 recipients for M1-MΦs and M2-MΦs). aP < .05 vs Input, bP < .05 vs W/O MΦ, cP < .05 vs MΦ, dP < .05 vs Input and W/O MΦ, eP < .05 vs Input and MΦ, fP < .05 vs all other groups, gP < .05 vs all other groups except MΦs, 2-way ANOVA. (E) Competitive repopulation unit assay reveals that LSK cells cocultured with M2-MΦs resulted in a 13-fold expansion of long-term (4 months) repopulating HSCs compared with the input cells.

