
Figure 2. Scatterplot depicting the association between impulsive risk-taking as indexed by the Behavioral Analogue Risk Task (BART) and frequency of eating of sweet/dessert foods as indexed by the Food Frequency Questionnaire (FFQ) MESA subscale.
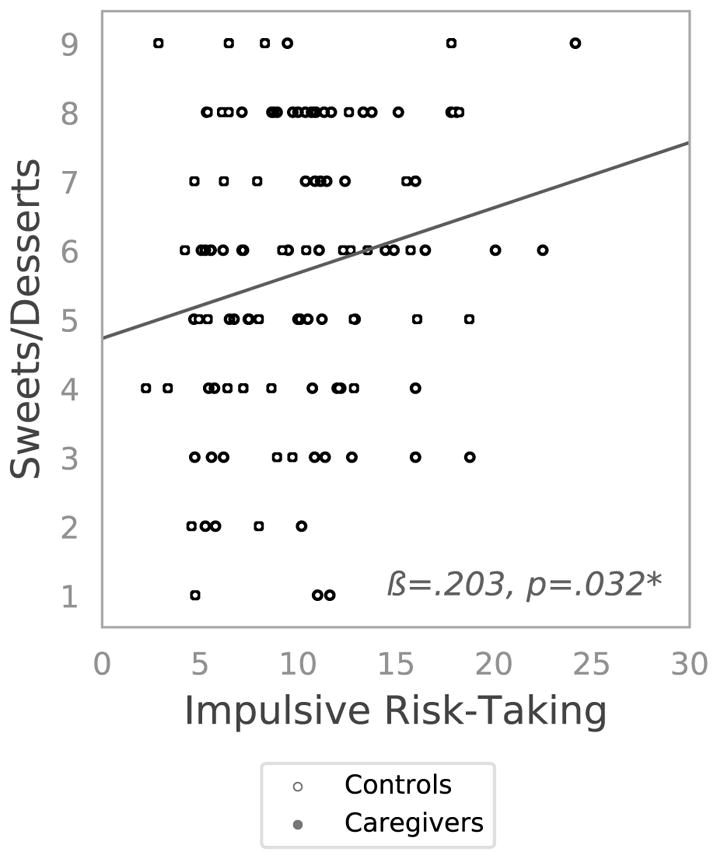
*p ≤.05. Mothers of children with an autism spectrum disorder (caregivers, high stress) are depicted as filled circles, whereas mothers of neurotypical children (controls, low stress) are depicted with open circles. The association did not significantly differ by group.