Abstract
Protein-protein interactions for solutions of an IgG1 molecule were quantified using static light scattering (SLS) measurements from low to high protein concentrations (c2). SLS was used to determine second osmotic virial coefficients (B22) at low c2, and excess Rayleigh profiles (Rex/K vs c2) and zero-q structure factors (Sq=0) as a function of c2 at higher c2 for a series of conditions (pH, sucrose concentration, and total ionic strength (TIS)). Repulsive (attractive) interactions were observed at low TIS (high TIS) for pH 5 and 6.5, with increasing repulsions when 5% w/w sucrose was also present. Previously developed and refined coarse-grained (CG) antibody models were used to fit model parameters from B22 vs TIS data. The resulting parameters from low-c2 conditions were used as the sole input to multi-protein Monte Carlo simulations to predict high-c2 Rex/K and Sq=0 behavior up to 150 g/L. Experimental results at high-c2 conditions were quantitatively predicted by the simulations for the CG models that treated antibody molecules as either 6 or 12 (sub)domains, which preserved the basic shape of a monoclonal antibody. Finally, preferential accumulation of sucrose around the protein surface was identified via high-precision density measurements, which self-consistently explained the simulation and experimental SLS results.
INTRODUCTION
The limited stability of protein solutions currently requires extensive experimental evaluation of solution properties and quality attributes during the development stages of biopharmaceuticals.1–6 For instance, physicochemical properties and key quality attributes such as protein solubility and aggregation, and solution opalescence and viscosity are difficult to predict for highly concentrated protein solutions (upwards of 100 g/L).2,7–9 Such high-concentration conditions have been increasingly targeted for monoclonal antibody (MAb) solutions when developing self-injectable products.2,4 Protein physicochemical properties are sensitive to changes in solution formulation conditions such as pH, ion concentration and chemical identity, and the presence of other excipients. They also depend on protein identity (sequence, structure, binding affinity, etc.), storage temperature, and mechanical stresses (shaking, stirring, etc.).2–11 This leads to an exceedingly large experimental space to be contend with during the development stages of any MAb, or more generally any protein product. It would be beneficial to have molecular- and/or sequence-based models that could reduce the formulation space by predicting at least a subset of these properties while minimizing the amount of experimental data needed as inputs.
So called “colloidal” or “weak” protein-protein interactions have been shown to correlate, in some cases, with protein phase separation, opalescence, aggregation rates, and elevated viscosities.3,7,8,12 These interactions can be characterized experimentally using laser scattering (LS), analytical ultracentrifugation, small-angle neutron and/or x-ray scattering (SANS and SAXS, respectively), and osmometry.3,12–18 Each of these methods allows one to measure second osmotic virial coefficients (B22) as a function of solution formulation, but this interaction parameter is limited to dilute conditions (typically below ~10 g/L). Recent work has highlighted that changes in protein-protein interactions as a function of protein concentration (c2) can be quantified using at least a subset of these experimental techniques.3,7,12,19 Static light scattering (SLS) experiments allow one to directly measure protein interactions as a function of c2 up to high concentrations, in the form of Kirkwood-Buff (KB) integrals, particularly the protein-protein KB integral, G22.3,12,20 This is also effectively the same as the static structure factor at the zero-q limit (Sq=0).20 SLS provides Sq=0 and B22 values more easily and/or with greater accessibility or higher throughput compared to other techniques. This makes SLS an attractive method to experimentally quantify protein-protein interactions for a range of solution formulations (see also, Methods).3,12,21
Colloidal or “weak” protein-protein interactions arise from three main contributions: steric repulsions (i.e., excluded volume effects); short-ranged non-electrostatic attractions such as van der Waals interactions and hydration/solvation effects; and long- or short-ranged electrostatic attractions and repulsions.12,22,23 The balance between these forces is mediated by the solution formulation and the protein of interest.2,3,6,21,24–27 While these forces are relevant at both low- and high-c2 conditions, the average distance between protein molecules at higher c2 is necessarily much smaller than at low c2. As the distance-dependence of each of the forces listed above is different, it is expected that greatly changing c2 can considerably affect the balance of these forces.12,21,23,28,29 Additionally, most simplified molecular models, such as coarse-grained (CG) models, treat the solvent implicitly. This may lead to incorrect estimations of inter-protein forces when the average distance between protein molecules is of the order of a few water (hydration) layers (~1 nm).30–33 Previous work with colloidal models applied to globular proteins showed that protein interactions at high c2 can be predicted accurately from only low-c2 behavior under certain solution conditions.12,34 However, that approach was tested only for the case of a simpler model protein, and it has yet to be assessed for highly asymmetric proteins such as MAbs, where packing effects may be greatly different from globular proteins and colloids.16,23,35
Previous work often has used a colloidal description of inter-particle interactions to describe protein solutions.12,22,23,34 For instance, CG models with implicit solvent were developed to self-consistently capture physical volume and excluded volume effects of MAb solutions.23 Such models were also developed to at least qualitatively capture trends in protein-protein interactions at low- and high-c2 conditions.12,23 Although simplified descriptions of MAbs in solution have been historically employed as a minimalist approach, the validity of using CG models for protein solutions has been raised in some cases.12,22,23,34 This arises from the complex structural nature of antibodies, compared to traditional colloidal particles, and the fact that protein-protein interactions are potentially strongly influenced by factors such as pH, total ionic strength (TIS), added excipients, protein concentration (c2), protein sequence, and the three-dimensional structure and heterogeneous surface chemistry of proteins. Recent examples raised the question of whether purely CG descriptions of protein behavior are practically useful for capturing or predicting high-c2 properties of protein solutions.12
The present work considers the challenge of using CG molecular models to predict experimental protein interactions (via excess Rayleigh scattering) for highly concentrated antibody solutions using simple structural/sequence information and limited low-c2 experimental data as the only model inputs. The excess Rayleigh profiles (Rex/K vs c2) of an IgG1 protein were experimentally determined as a function of pH, TIS and sucrose content. B22 values were determined from low-c2 experiments and used to parameterize a previously developed CG antibody model as a function of pH, in terms of only two model parameters. These parameters capture the balance between short-ranged non-electrostatic attractions and the ratio of the true and theoretical charges on the domains of an IgG1 molecule at a given pH, without prior knowledge of the high-c behavior. Experimental high-c2 Rex/K results were then predicted using the low-c2 parameters using multi-protein Monte Carlo simulations, which included upwards of 500 MAb molecules interacting simultaneously. The results are discussed from both qualitative and quantitative perspectives, highlighting strengths and weaknesses of the approach for net-repulsive and net-attractive conditions. Finally, partial specific volume measurements and protein-excipient KB integrals were used to rationalize the effect of adding sucrose to the protein solution from the perspective of preferential solute and solvent interactions, protein-protein interactions, and the model parameters determined from experimental and simulated B22 data.
MATERIAL AND METHODS
Sample preparation
Sodium acetate buffer stock solutions were prepared by dissolving glacial acetic acid (Fisher Scientific) in deionized water (MilliQ, Millipore-Sigma) to reach 10 mM acetic acid, and titrated to pH 5.1 ± 0.05 (termed pH 5 below) using a 5 M sodium hydroxide solution (Fisher Scientific). Similarly, 10 mM histidine buffer stock solutions were prepared by dissolving histidine hydrochloride (Sigma) in deionized water and titrating to pH 6.5 ± 0.05 (termed pH 6.5 below). A stock IgG1 solution was provided by Bristol-Myers Squibb at a starting c2 of ~50 g/L. pH 5 and pH 6.5 protein stock solutions were filtered and dialyzed using 10 kDa molecular weight cutoff (MWCO) Spectra/Por dialysis membrane (Spectrum Laboratories, Rancho Dominguez, CA) with the desired buffer using four 12-hr buffer exchanges at 4 °C to remove any undesired solutes from the original protein solution.
Excipient stock solutions were prepared by dissolving sucrose (HPLC grade, Sigma) and/or NaCl (Fisher Scientific) in 10 mM buffer solutions (acetate for pH 5 and histidine for pH 6.5) to obtain final solutions of 30% w/w sucrose and/or 1.3 M NaCl. Those solutions were titrated to the respective pH with small volumes of a 5 M sodium hydroxide solution. Final protein solutions were prepared gravimetrically by combining (1) protein stock solution, (2) pH-adjusted buffer, (3) excipient stock solution with a matched buffer. The proportions of (1), (2), and (3) were selected to achieve a constant excipient concentration and pH as specified in Table 1. This was done for a series of increasing c2 values every 0.25 g/L up to a maximum of 1.5 g/L (for density measurements) or every 1 g/L up to a maximum of 10 g/L (for low-c2 SLS measurements) to ensure sufficiently dilute protein conditions.3,12
Table 1.
Summary of formulations for low-c2 data.
| Formulation | Additional excipient (concentration range) | Experiment |
|---|---|---|
| pH 5, 10 mM acetate | NaCl (0 – 500 mM) |
SLS |
| pH 5, 10 mM acetate + 5% w/w sucrose | SLS | |
| pH 6.5, 10 mM histidine | NaCl (0 – 350 mM) |
SLS |
| pH 6.5, 10 mM histidine + 5% w/w sucrose | SLS | |
| pH 5, 10 mM acetate | Sucrose (0 – 24% w/w) |
Densimetry |
| pH 6.5, 10 mM histidine | Densimetry |
For c2-conditions above 10 g/L, concentrated protein stock solutions were prepared through membrane centrifugation at ~ 3200 RCF using 10 kDa MWCO Amicon-Ultra centrifugal tubes (Millipore-Sigma) and two buffer exchange steps. A pH shift was observed as the protein solution was concentrated from ~35 g/L to ~160 g/L, therefore starting pH values of 4.3 and 5.9 were selected for the dialysis with resulting pH values of 5.06 ± 0.05 and 6.49 ± 0.05, respectively, for final 160 g/L solutions after centrifugation with two buffer exchange steps. Lower-c2 samples were then prepared by gravimetrically diluting the concentrated protein solutions in the desired buffer to obtain c2 values ranging from 10 to 150 g/L. Final excipient and c2 values were later calculated and corrected with measured density values (see below) and UV-VIS spectrophotometry (Agilent 8453, Santa Clara, CA) at 280 nm using an extinction coefficient of 1.54 L g−1 cm−1, before and after dilution from the concentrated stock solutions.3 Less than 0.1% variation between targeted and actual values for the protein and excipient concentrations was achieved in all cases.
Static light scattering (SLS)
Batch SLS experiments were conducted using a Wyatt Technology (Santa Barbara, CA) DAWN HELEOS II instrument with laser wavelength (λ) of 658.9 nm at 25.0 ± 0.1°C. In SLS, the average scattered intensity at 90° can be determined and used to calculate the excess Rayleigh ratio, represented as Rex, as previously reported.3,20 Measurements of Rex as a function of c2 can be used to estimate protein-protein interactions in the form of the protein-protein Kirkwood-Buff integral, G22, as shown in equation 1. K is the optical constant and equal to , with n denoting the solution refractive index, (dn/dc2) is the change in solution refractive index as a function of protein concentration, and NA is Avogadro’s number. Mw,app is the protein apparent molecular weight, and M is the protein true molecular weight.3,20
| (1) |
The zero-q limit for the structure factor (Sq=0) can be obtained from static light scattering at a single angle (90° in the present work) if there is no angle-dependence of the scattered light.20 This is usually valid for protein solutions as proteins are much smaller than the laser wavelength, and this holds in the absence of long-ranged density fluctuations such as those observed near critical points and phase boundaries more generally.3,12,20,23 Sq=0 can be obtained by dividing the right hand side of equation 1 by c2Mw, with the canonical simplification that Mw,app ≈ Mw.3,12,20,23 In this case, Sq=0 is equal to 1 + c2G22 and is dimensionless.3,12,20,23 Values of (dn/dc2) were determined using a J157HA Refractometer (Rudolph Scientific, Hackettstown, NJ) for c2 values up to 10 g/L for each formulation. The values were 0.203 ± 0.03 mL/g for all buffer-only and NaCl formulations, and 0.220 ± 0.04 mL/g for all formulations with 5% w/w sucrose, for both pH values.
In the limit of dilute protein conditions (i.e., c2 below approximately 10 g/L and ||c2G22|| < 0.1),3,12,20 it holds that G22 ≈ −2B22, with B22 denoting the protein second osmotic virial coefficient.20,23,29,36,37 As B22 is independent of protein concentration, B22 values were obtained by fitting experimental excess Rayleigh profiles to equation 1 for low-c2 conditions, and setting B22 = −½G22.3,12 Additionally, KB theory and the corresponding analysis and Eq. 1 are applicable at higher c2, and can be used to quantify protein-protein interactions at high c2 from SLS data. A negative (positive) G22 value is equivalent to Sq=0 values below (above) 1, and corresponds to net repulsive (attractive) interactions. Correspondingly in dilute solutions, positive (negative) B22 values indicate net repulsions (attractions).
High-precision density measurements
Solution density (ρ) measurements were carried out using a DDM 2911 Plus density meter (Rudolph Scientific, Hackettstown, NJ). All measurements were done at 25.00 ± 0.02 °C and ambient pressure. Partial specific volume values were determined from high precision density measurements as a function of weight fraction (wi) using equation 2, as previously described.38,39 Linear regression was used to obtain the intercept and the slope as needed in equation 2. 95% confidence intervals for were obtained from the corresponding t-value and standard error analyses of the slope and the intercept with error propagation for a given component i.38,39
| (2) |
Preferential interactions were obtained by calculating protein partial specific volumes as a function of sucrose concentration (c3) at a constant concentration of buffer (c4) and comparing the results to equation 3, where κT represents the isothermal compressibility of the solution, R is the gas constant and T is the solution temperature. Gi2 values represent the interaction between a given molecular species i and the protein (subscript 2).
| (3) |
Keeping with standard notation, subscripts 1 and 3 denote water and excipient (sucrose), respectively. The difference (G12-G23) is equivalent to the preferential interaction between water and protein, relative to sucrose and protein molecules.38–41 A positive difference is characteristic of preferential exclusion or desolvation of sucrose, while a negative difference is characteristic of preferential accumulation, binding or solvation of the excipient to the protein surface.24,30,38–42 This behavior can be observed by plotting as a function of , with being the partial specific volume of the excipient in the same buffer solution (i.e., c2 → 0 g/L).39 The first term on the right-hand side in equation 3 (RTkT/Mw,2) is negligible compared to the other terms for liquids far from their critical point.38,39 Similarly, previous work has shown that the last term on the right-hand side can be assumed to be negligible and/or c3-independent for low concentrations of buffer (<30 mM) due to values being ~ 10−3 and with physically reasonable (G12-G24) values.39
Coarse-grained MAb models and interaction parameters
Two different coarse-grained (CG) molecular models were used to model low-c2 behavior and predict high-c2 SLS experimental behavior. These were a subset of a larger group of possible CG molecular models that were tested in earlier work that showed these two models can provide an optimal balance between accuracy and computational burden.23 Figure 1 shows a schematic of the geometric constraints in these CG models, referred to as the HEXA and DODECA models in the remainder of this report. These models were developed in previous work to resemble the overall shape of a MAb molecule, and used 6 (HEXA) or 12 (DODECA) beads per protein. Additional details of the development of the models can be found elsewhere.23 A modification to the previously proposed description of short-ranged non-electrostatic attractions was made here to achieve an effective attractive range of ~1 nm for both the HEXA and DODECA models (compared to equation 9 in Ref. 23). This was achieved by modifying the range of attractions for the DODECA model in comparison to previous work as shown in equation 4 and explained below. In equation 4, εSR represents the strength of the short-ranged non-electrostatic attractions, n represents the range of the attractions, and is equal to 6 for the DODECA model and 10 for the HEXA model. c is a normalization factor to make the interaction energy equal to −εSR at its minimum value, and is equal to 1.2196 for the DODECA model and 1.3464 for the HEXA model.23
| (4) |
Figure 1.
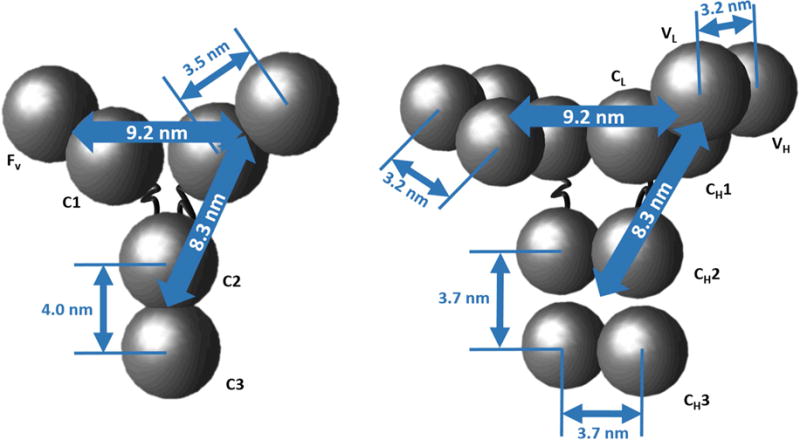
Geometries of HEXA and DODECA coarse-grained models. Domain diameters (σi) were equal to 3.5 nm for the DODECA and 4.4 nm for the HEXA model.
Similarly, a modification to the previously proposed electrostatic model was made to better model experimental data. This was achieved by changing from a Yukawa potential (equation 10 in Ref. 23) to a modified screened-Coulomb potential as shown in equation 5.12,23,43
| (5) |
ζ corresponds to the Bjerrum length and is equal to (4πεεokBT)−1, with ε representing the solution relative permittivity at a given temperature, εo is the vacuum permittivity (in units of qe2N−1 m−2, with qe representing the elemental charge of an electron),43 kB is the Boltzmann constant, and T is the absolute temperature. For solutions considered here, ζ was equal to 7.15 Å for any buffer + NaCl formulations at 25 °C, and 7.26 Å for formulations with 5% w/w added sucrose at 25 °C.44 qi and qj are the theoretical valences of domain/fragment/amino acid i and j, respectively, as calculated from the protein sequence (see below), while ψi (or ψj) is used to scale the theoretical charge such as ψiqi (or ψjqj) is equal to the effective valence in solution, qi,eff (or qj,eff). σij is the average diameter of beads i and j, equal to ½(σi + σj), where σi and σj are the diameters of the ith and jth bead or (sub)domain, respectively. κ is the Debye screening length based on the TIS of the solution.12,23,43,45,46 rij is the center-to-center distance between the interacting beads i and j. The interaction potential in equation 5 allows one to better capture electrostatic phenomena, and can allow for easier comparison with electrophoresis measurements.45
Theoretical valence values (qi) were calculated using the standard Henderson-Hasselbach equation.47 The protein sequence was provided by Bristol-Myers Squibb, including a homology model for capturing the molecule geometry (see Fig. 1). This sequence was partitioned into equal-chain-length units to compute the charge of each HEXA or DODECA model bead. For the HEXA model calculations, the Fv domain was composed of the upper half of the light chain (residues 1-107) and the upper quarter of the heavy chain (residues 1-118) (i.e., combining both VH and VL domains); the C1 domain was composed of the lower half of the light chain (residues 108-214) and the second quarter of the heavy chain (residues 119-234) (i.e., combining both CH1 and CL domains); the C2 domain was composed of residues 244-357 of each heavy chain (i.e., both CH2 domains); and the C3 domain was composed of last quarter of each of the heavy chains (residues 358-474) (i.e., both CH3 domains). For the DODECA model calculations, the heavy chains were portioned into four units (residues 1-118 for the VH, 119-234 for the CH1, 244-357 for the CH2, and 358-474 for the CH3) and the light chains into two units (residues 1-107 for the VL, and 108-214 for the CL) for a total of 12 beads, each with its respective net charge.23 In what follows, the terms valence and charge will be used interchangeably. Examples of the theoretical charge distribution for the DODECA model are shown in Figure 2, while the theoretical charge values are shown in Table 2 for pH 5 and 6.5 for both CG models.
Figure 2.
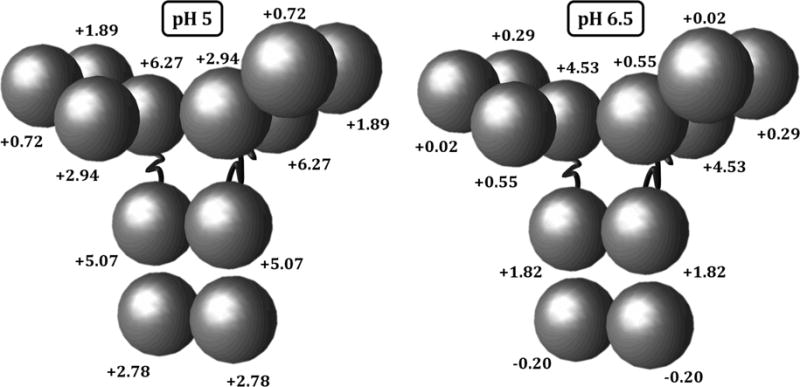
Theoretical charge distribution for the DODECA model at pH 5 and 6.5 for the IgG1 molecule in this work.
Table 2.
Theoretical charges at pH 5 and 6.5.
| Model | qVH | qVL | qCL | qCH1 | qCH2 | qCH3 |
|---|---|---|---|---|---|---|
| DODECA, pH 5 | 1.89 | 0.72 | 2.94 | 6.27 | 5.07 | 2.78 |
| DODECA, pH 6.5 | 0.29 | 0.02 | 0.55 | 4.53 | 1.82 | −0.20 |
| HEXA, pH 5 | 2.61 | 9.21 | 10.14 | 5.56 | ||
| HEXA, pH 6.5 | 0.31 | 5.08 | 3.64 | −0.40 | ||
Monte Carlo simulations for both low- and high-c2 conditions
Low c2
Low c2: the HEXA and DODECA models were used to compute B22 for a given pH and TIS using the Mayer Sampling method employing the Overlap Sampling algorithm (MSOS) developed by Kofke and coworkers.12,23,48 A similar methodology to the one employed before23 was used here: MSOS simulations were performed at 25 °C with 107 Monte Carlo (MC) attempts for both the reference system and the model of interest.12,23 Each MC attempt consisted of either a translation or a rotation around the center of mass of the first protein molecule using the center of the second molecule as the origin. The maximum displacement and rotation were obtained with a pre-equilibration step of 105 MC attempts where those values were adjusted to obtain an acceptance ratio of 50%. The steric-only behavior of the protein was used as a reference, so the simulation directly returned B22/B22,ST, where B22,ST represents the steric-only second osmotic virial coefficient (i.e., the value due to only protein excluded volume contributions) as explained elsewhere and below.12,23 The following simulations were performed: B22/B22,ST was calculated for εSR values between 0 and 2 kBT, ψi values between 0 and 1.5, and TIS values between 0 and 510 mM for both CG models. The obtained B22/B22,ST values were compared to experimental values for further parameter tuning (see Discussion below). Statistical uncertainties were estimated by performing 5 independent simulations for each model parameter set and a given solution condition. The standard deviation was used as the estimate of statistical uncertainty, including error propagation.
High c2
Transition Matrix Monte Carlo (TMMC) was used to compute Rex/K vs c2 profiles for c2 values above 10 g/L using the methods described below. The particular parameter values were based on the MSOS simulations and experimental B22 values described above and in the next section.12 The simulations were carried out in a grand-canonical (osmotic) system. An initially uniform concentration probability distribution was used, which was subsequently reconstructed at the end of each cycle until it converged to the equilibrium probability distribution, with each cycle being defined as 106 MC attempts. A MC attempt consisted of one of the following randomly selected moves: a translation, a rotation or a molecule insertion or deletion. Translations and rotations represented 30% of all MC attempts, while deletions and insertions represented the remaining 70%. Temperature was held constant at 25 °C. Preliminary simulations were used to find an adequate value of the reference chemical potential, depending on the parameter value(s) (see below). Due to boundary effects, G22 was observed to depend on the box size for c2 > 30 g/L and box lengths below 50 nm.49,50 Consequently, a box length from 60 nm to 180 nm was used, where simulated values of G22 were not found to significantly depend on the box length, and larger box sizes were used for low-c2 conditions to decrease the noise on simulated G22 values. The simulation box was started with an empty system and G22 values were calculated by using histogram reweighting on the c2 probability distribution using equation 6, where 〈N2〉 represents the average number of protein molecules in the system, and represents the average fluctuations in the number of protein molecules for a given choice of protein chemical potential.
| (6) |
Excess Rayleigh profiles and Sq=0 values were obtained by inserting simulated values of c2G22 in equation 1 with a M value of 146.5 kDa and assuming that Mw,app and Mw are equal.3,12,23
Steric-only behavior as a reference state and the corresponding equation of state (EoS)
The steric-only behavior can be used as a reference state, as this corresponds to the baseline level of interactions any macromolecule would experience in solution if non-steric repulsions counter-balance any attractions.23,28 In the case of low-c2 behavior, steric interactions are c2-independent. This results in a B22 value of ~0.01 L/g, termed B22,ST in the remainder of this work.23 This value can be used to normalize B22 values across different solution formulation. Consequently, B22/B22,ST values above 1 are representative of additional repulsions (beyond sterics), which will be termed “net-repulsive” in the remainder of this report. Similarly, B22/B22,ST values below 1 are representative of attractions that overcome the steric-only behavior of the protein, and this will be termed “net-attractive” in the remainder of this report.
For higher c2 values, it is necessary to develop expressions to compute the c2-dependent steric interactions. Previous work computed those interactions as a function of c2 using several CG models, including those used in this work.23 Grand Canonical MC simulations were carried out to obtain values of c2 vs μ2, with μ2 representing the protein chemical potential. These results can be used to compute a steric-only EoS to analytically calculate the high-c2 behavior due to only steric interactions. This can then be used as a c2-dependent reference state instead of the ideal gas or non-interacting behavior (i.e., B22 = 0 or Sq=0 = 1). The analytical steric EoS was based on the virial expansion as is done in the McMillan-Mayer solution theory (referred to as VE below, as short-hand for Virial Expansion).28,29,36,46 The VE-EoS provides a simple 4th-order polynomial as shown in equation 7, which can be used to analytically calculate thermodynamic properties. This approach is expected to strongly deviate from real multi-body behavior as c2 increases beyond the range of simulated concentrations (i.e., above 180 g/L).
| (7) |
In equation 7, ΠST represents the osmotic pressure of the protein in solution, R is the gas constant and T is the absolute temperature. η corresponds to the protein volume fraction in solution (= v2·c2). v2 is the protein molecular volume and was previously computed using atomistic simulations and found equal to 0.924 mL/g (see Table 2 in Ref. 23) for a series of MAb molecules.23 The analytical steric-only EoS models was fitted to simulated data by minimizing the error in both the isothermal compressibility (κT,ST = (∂c2/∂ΠST)T*c −12) and the osmotic pressure (ΠST) as a function of protein volume fraction (κT,ST vs η and ΠST vs η, respectively) for values of η < 0.165 (i.e., c2 < 180 g/L). The resulting parameters obtained from error minimization are shown in Table 3. The reader must take into account that extrapolating to higher volume fractions (or c2 values) above 180 g/L is discouraged as additional parameters might be required to capture more crowded environments.20,23,29,46 Final steric-only G22 values (G22,ST) as a function of c2 were calculated using equation 8 combined with equation 7 and the parameters in Table 3.
| (8) |
Table 3.
Model parameters for the steric-only EoS.
| A1 | A2 | A3 | A4 | A5 |
|---|---|---|---|---|
| 1† | 10.551 ± 0.006 | 62.2 ± 0.2 | 136 ± 1 | 468 ± 4 |
Preset to comply with dilute limit behavior (ideal gas EoS)
Average Relative Deviation (ARD) calculations and model validation
To evaluate the effectiveness of the present CG models to model or predict experimental SLS behavior, the average relative deviation (ARD) values were calculated for any given data set using equation 9,
| (9) |
where n in Eq. 9 represents the number of data points (as opposed to its usage in Eq. 4) and xi is the experimental or simulated value to be evaluated (e.g., B22/B22,ST vs TIS, and Rex/K vs c2 in this work). As the ARD is a measurement of the average deviation between the model and the experimental data, a cutoff value between 10% and 20% was used below as a criterion for considering a prediction to be quantitatively accurate, as this average deviation can be considered a conservative estimate of the model prediction uncertainty, particularly given typical experimental uncertainties for SLS data.
Parameter tuning from low-c2 data
To predict high-c2 Rayleigh profiles from low-c2 measurements using the formulated CG models, B22/B22,ST vs TIS experimental data were used to tune two model parameters: the strength of short-ranged non-electrostatic attractions (εSR), and the correction factor to the theoretical charges ψi (see above).12 Additional model parameters were refined in previous work based only on the geometry of multiple MAbs from their published crystal structures, as well as the homology model for this molecule (see above).23 Under high-TIS conditions, electrostatic interaction are expected to be heavily screened (according to the Debye-Hückel theory), so B22/B22,ST values under these conditions can be used to set the value of εSR by combining experimental and simulated data (see Results and Discussion). Conversely, low-TIS conditions are expected to be dominated by electrostatic interactions, and this can be used to determine an optimized value of ψi. For simplicity, all ψi values were assumed to be equal for all the domains. Consequently, ψi will be referred as ψ in the remainder of this work, as an average correction factor for all theoretical charges at a given pH. Similarly, εSR will be used as an averaged short-ranged attraction strength (for solvation and hydration effects, and van der Waals attractions) and equal for all the molecule domains. This could be modified in future work to account for additional domain-specific information such as relative hydrophobicity, but was not used in the present work.
The following methodology was employed for the parameter tuning exercise: B22/B22,ST vs TIS values were simulated using both the HEXA and DODECA models using the MSOS algorithm for a range of [εSR, ψ] pairs. ARD values were computed for each pair by comparing experimental and simulated B22/B22,ST vs TIS results. Experimental B22/B22,ST values between - 0.05 and 0.05 were excluded from any ARD calculation to avoid heavy biasing on final ARD values. This was done to avoid the inherently larger experimental uncertainties in B22/B22,ST results when those values are near zero. Surface plots of ARD vs [εSR, ψ] were constructed, where a funnel-like behavior is expected if there is a unique subset of [εSR, ψ] pairs that minimizes the ARD results. As there is uncertainty in experimental B22/B22,ST values, the previous exercise would result in a parameter space of [εSR, ψ] pairs that can accurately mimic the experimental data, as shown below and in previous work.12 Consequently, all simulated [εSR, ψ] pairs that resulted in ARD values below 20% were subsequently used to predict high-c2 Rayleigh scattering behavior, creating a predicted “envelope” for Rex/K rather than a single curve.
RESULTS
SLS was used to determine excess Rayleigh profiles (Rex/K as a function of c2) for a series of solution conditions. At low c2, these measurements were used to determine B22 values as a function of TIS by changing the NaCl molarity. Figure 3 shows the results of B22 vs TIS for two series of formulations (buffer + NaCl, and buffer + 5% w/w sucrose + NaCl) and two pH values, 5 (panel A) and 6.5 (panel B), all measured for c2 < 10 g/L. B22 values were normalized using the steric-only behavior from a 3D-homology model (B22,ST = 0.01 L/g) as a reference state and for easier comparison with MSOS simulations.
Figure 3. Main panels.
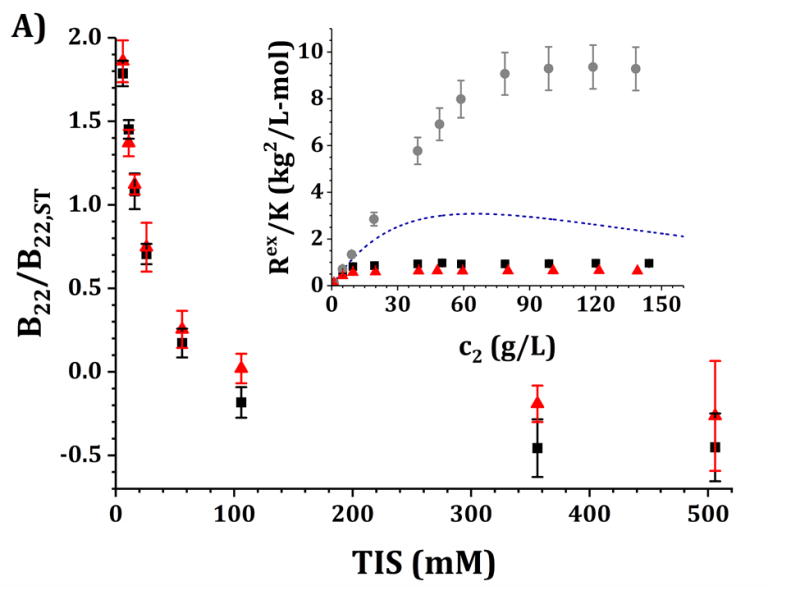
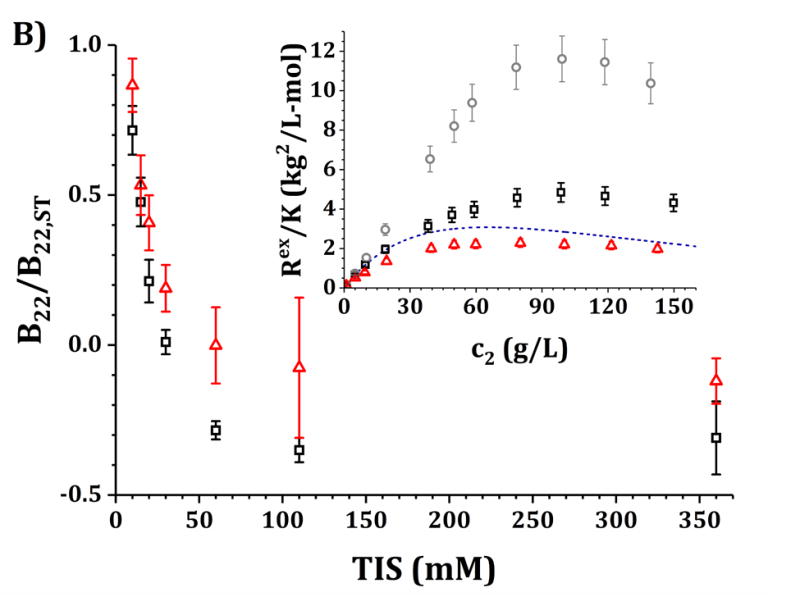
B22/B22,ST values as a function of TIS for the IgG1 molecule in this work at pH 5 and 10 mM acetate buffer (panel A) and pH 6.5 and 10 mM histidine buffer (panel B) with added NaCl from 0 to 500 mM. Black symbols represent data with only buffer and added NaCl while red symbols represent the same solutions with 5% w/w added sucrose. Insets: high-c2 data as shown in Ref. 3 but corrected as mentioned in the main text for pH 5 (panel A) and pH 6.5 (panel B) for buffer-only (black squares), 5% w/w sucrose (red triangles) and 100 mM NaCl (gray circles). The blue dashed line corresponds to the steric-only behavior calculated using the VE EoS (equation 7).
B22/B22,ST vs TIS profiles differ quantitatively between pH 5 and pH 6.5, and between both sucrose concentrations. At pH 5 and low TIS, protein-protein interactions were relatively large and net-repulsive (B22/B22,ST >> 1). Increasing TIS by adding NaCl decreases B22/B22,ST until reaching a constant value for TIS values above approximately 300 mM. At pH 6.5 and low TIS, protein-protein interactions were net-attractive, relative to steric-only interactions (B22/B22,ST < 1). Increasing TIS by adding NaCl decreases the magnitude of B22/B22,ST monotonically until reaching a constant value for TIS values above approximately 300 mM in all situations. B22/B22,ST values at high TIS (>300 mM) were the same for both pH values but less attractive (less negative) with the addition of sucrose, with similar high-TIS results in the presence of sucrose for both pH values. Conversely, B22/B22,ST values differ significantly across pH at low TIS (below 50 mM), where pH 5 resulted in larger (more repulsive) B22/B22,ST values than pH 6.5. The addition of sucrose did not result in statistically distinguishable behavior at low TIS across pH values.
Insets in Figs. 3A and 3B show the experimental Rex/K vs c2 (high-c2) results for the formulations presented in Table 4 and that correspond to the low-c2 measurements in the main panels.3 Additionally, the steric-only behavior for this molecule is shown as a reference, as computed using the VE EoS model (equations 7 and 8, and Table 3).23 The experimental values in the insets were shown previously,3 but with a new correction in the present work by using updated dn/dc2 values from the refractive index measurements (see Methods). In particular, the results for formulations with 5% w/w sucrose (red symbols) significantly changed based on the updated dn/dc2 values. In those cases, the dn/dc2 values were found to be 15% higher in the presence of sucrose than previously reported, so results in Fig. 3 at high c2 are ~30% lower in magnitude than previously reported.3 The results without sucrose are effectively unchanged from prior work.
Table 4.
Summary of formulation conditions and model parameter spaces that best predict the high-c2 SLS data (ARD ≤ 20%) shown in Figs. 6 and 7.
| Formulation | Short notation | HEXA | DODECA | ||
|---|---|---|---|---|---|
| εSR (kBT) | ψ | εSR (kBT) | ψ | ||
| pH 5, 10 mM acetate | pH 5, buffer-only | 1.1–1.2 | 0.37–0.40 | 0.70–0.74 | 0.50 |
| pH 5, 10 mM acetate + 5% w/w sucrose | pH 5, sucrose | 0.90–1.0 | 0.40 | 0.64–0.70 | 0.50 |
| pH 5, 10 mM acetate + 100 mM NaCl | pH 5, NaCl | 1.15 | 0.30–0.40 | 0.70–0.74 | 0.45–0.66 |
| pH 6.5, 10 mM histidine | pH 6.5, buffer-only | 1.1–1.2 | 0.56–0.68 | 0.70–0.74 | 0.90 |
| pH 6.5, 10 mM histidine + 5% w/w sucrose | pH 6.5, sucrose | 0.90–1.0 | 0.62–0.68 | 0.64–0.70 | 0.83–1.0 |
| pH 6.5, 10 mM histidine + 100 mM NaCl | pH 6.5, NaCl | 1.15 | 0.56–0.68 | 0.70–0.74 | 0.90–1.0 |
In summary, the results in Fig. 3A (pH 5) show that Rex/K profiles for both buffer-only and sucrose formulations are net-repulsive (Rex/K values below the steric-only behavior) without added NaCl, with Rex/K profiles for sucrose below (more repulsive than) those for buffer-only. Adding 100 mM NaCl results in a large increase in Rex/K values and brings the high-c2 values well above (more attractive than) the steric-only behavior. For Fig. 3B (pH 6.5), the buffer-only results overlap with the steric-only behavior at low c2, and adding 5% w/w sucrose results in a decrease in the Rex/K profiles (increase in repulsions) while adding 100 mM results in an increase in Rex/K values (increase in attractions). In each formulation (buffer-only, buffer + sucrose, and buffer + NaCl), Rex/K values at pH 5 are lower in magnitude than those at pH 6.5 for equal c2 values.
Figures 4 and 5 show a comparison of B22/B22,ST vs TIS between experiments and simulations for the HEXA and DODECA models coupled with MSOS simulations, respectively. The experimental data and formulations are the same as those presented in Fig. 3 and Table 1. Shaded areas in the main panels represent the simulated B22/B22,ST vs TIS profiles obtained from ARD values below 20% (gray minima in surface plots in the insets). The insets show colored surface plots of ARD as a function of εSR and ψ values. From those parameter-response surfaces, one can identify a narrow parameter space (values for εSR and ψ, also referred as [εSR, ψ] pairs) that accurately captures the low-c2 experimental behavior with a given CG model. That range of [εSR, ψ] pairs are further used to predict high-c2 SLS behavior.
Figure 4. Main panels.
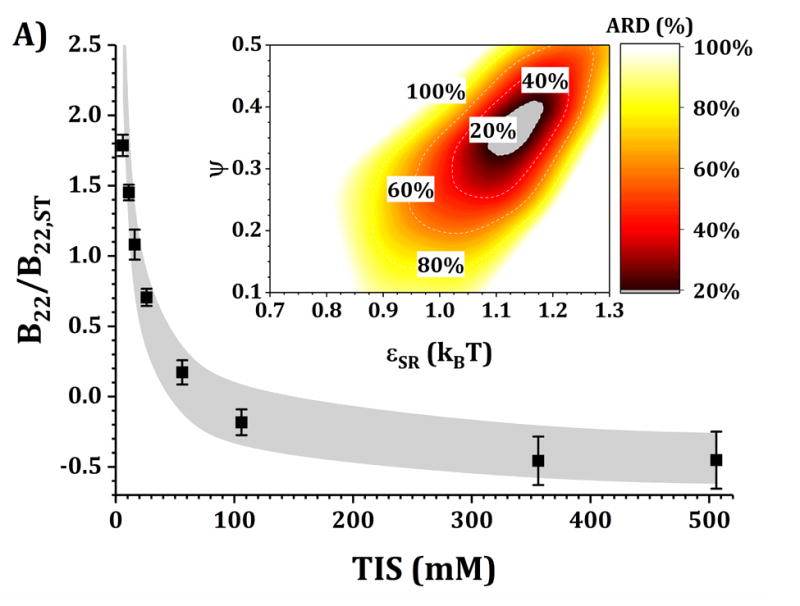
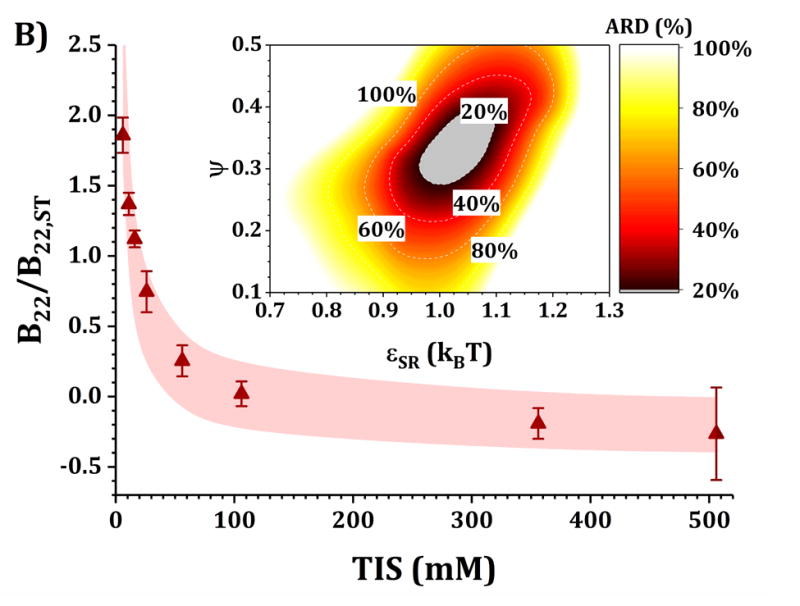
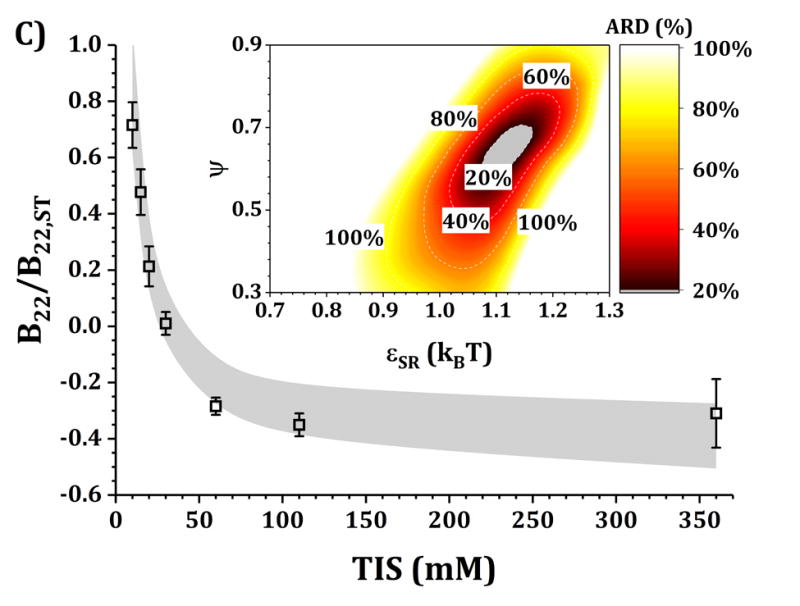
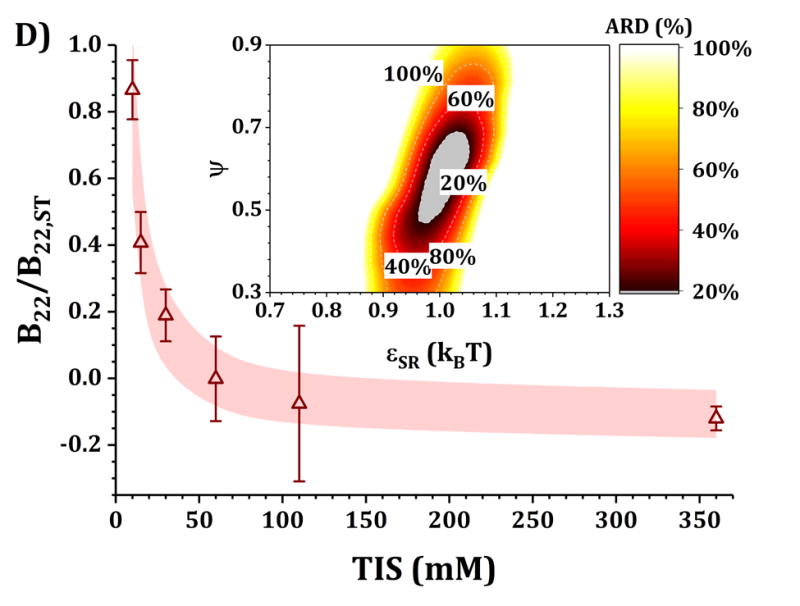
comparison of B22/B22,ST as a function of TIS between experimental (symbols) and simulated values (shaded areas) using the HEXA model at pH 5 for buffer-only (panel A) and 5% w/w added sucrose (panel B) and at pH 6.5 for buffer-only (panel C) and 5% w/w added sucrose (panel D). Inset: surface response of ARD values as a function of εSR and ψ for each respective formulation.
Figure 5. Main panels.
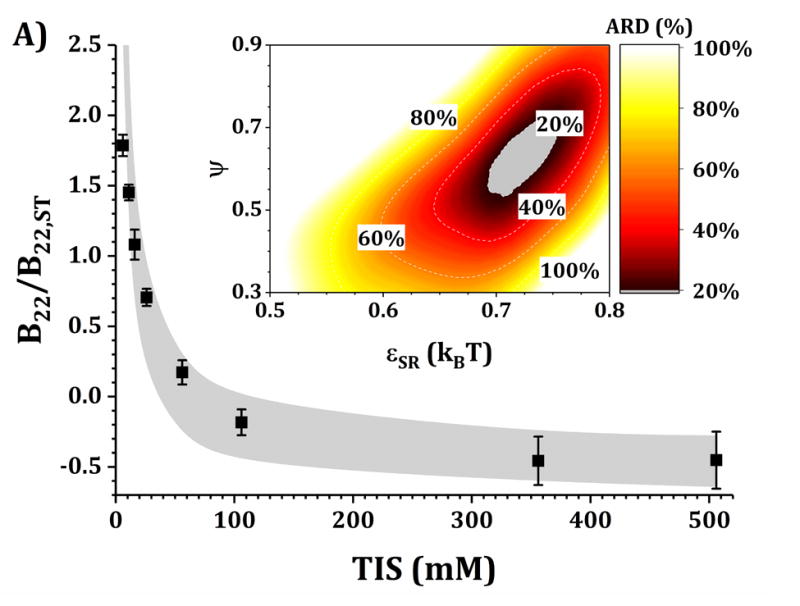
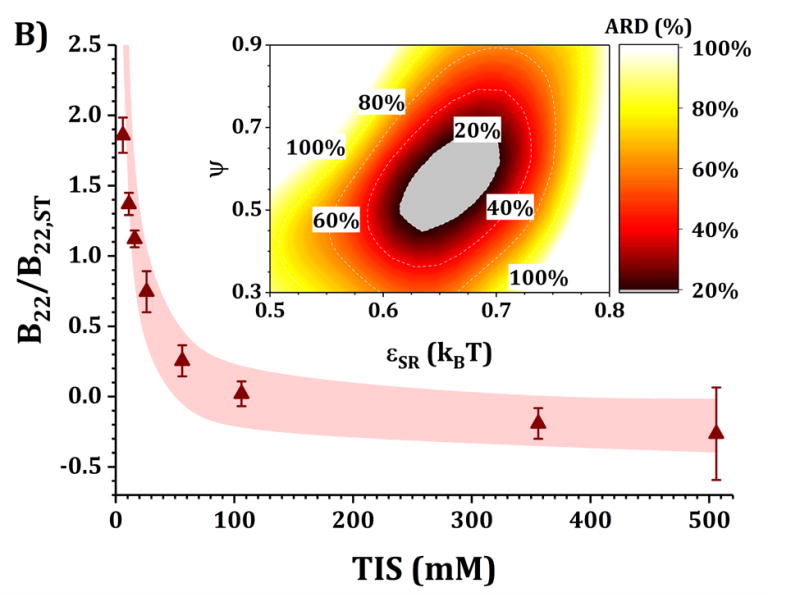
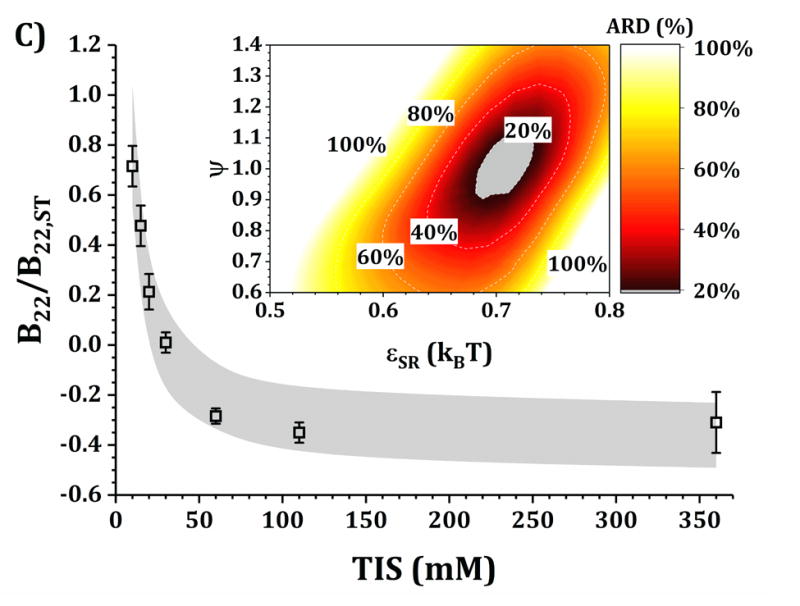
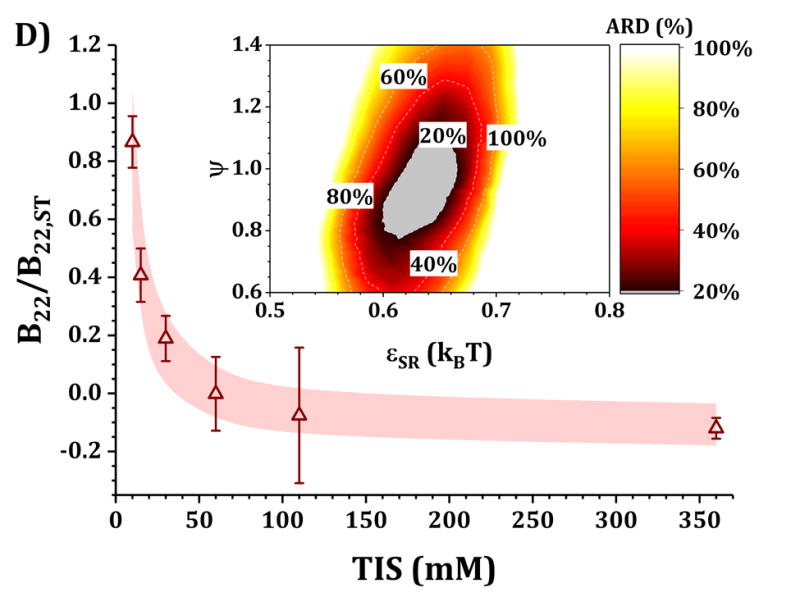
comparison of B22/B22,ST as a function of TIS between experimental (symbols) and simulated values (shaded areas) using the DODECA model at pH 5 for buffer-only (panel A) and 5% w/w added sucrose (panel B) and at pH 6.5 for buffer-only (panel C) and 5% w/w added sucrose (panel D). Inset: surface response of ARD values as a function of εSR and ψ for each respective formulation.
Figures 6 and 7 show a comparison of the experimental and predicted high-c2 excess Rayleigh scattering results as a function of protein concentration. The results from the HEXA and DODECA models are based on the TMMC simulations for the parameter space obtained by fitting low-c2 data (cf., Figs. 4 and 5). Fig. 6 corresponds to parameters from Fig. 4 and the HEXA model. Fig. 7 corresponds to parameters from Fig. 5 and the DODECA model. The formulation conditions are the same as shown in Table 4. Shaded areas in the main panels in Figs. 6 and 7 represent the confidence intervals of the predicted Rex/K vs c2 profiles using model parameters that resulted in an ARD value below 20% from the low-c2 parameter tuning (gray regions in insets of Figs. 4 and 5). The symbols in Figs. 6 and 7 represent the same experimental data shown in the insets in Fig. 3, including 95% confidence intervals as error bars. By visual inspection, the parameters obtained at low-c2 allow the CG models to be predictive of the high-c2 behavior within a 20% average deviation from 10 to 150 g/L. The steric-only behavior at high c2 is also included as a reference in Figs. 6 and 7. None of the predictions in Figs. 6 and 7 utilize experimental data from high c2 as inputs to the models, but do require knowledge of the B22/B22,ST values at each given solution condition. For reference, parameter ranges that predicted the high-c2 experimental behavior within 20% uncertainty are shown in Table 4 for both CG models.
Figure 6.
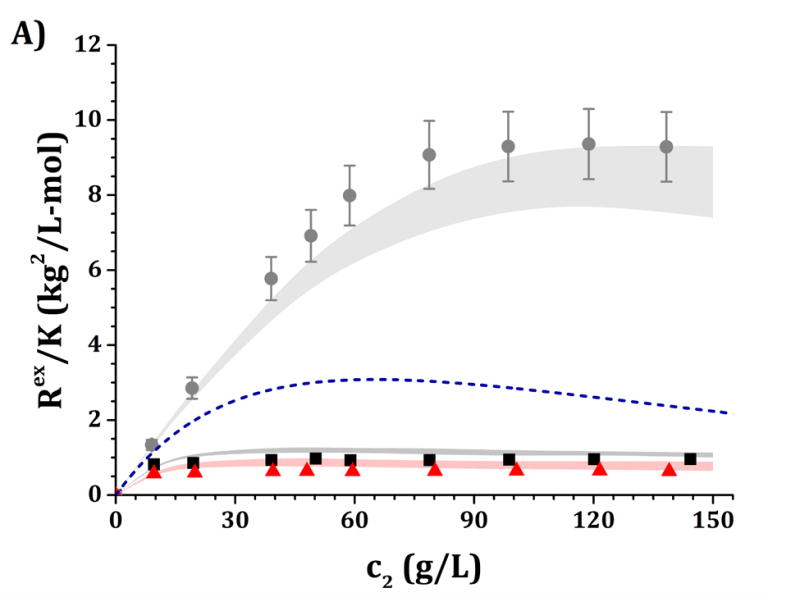
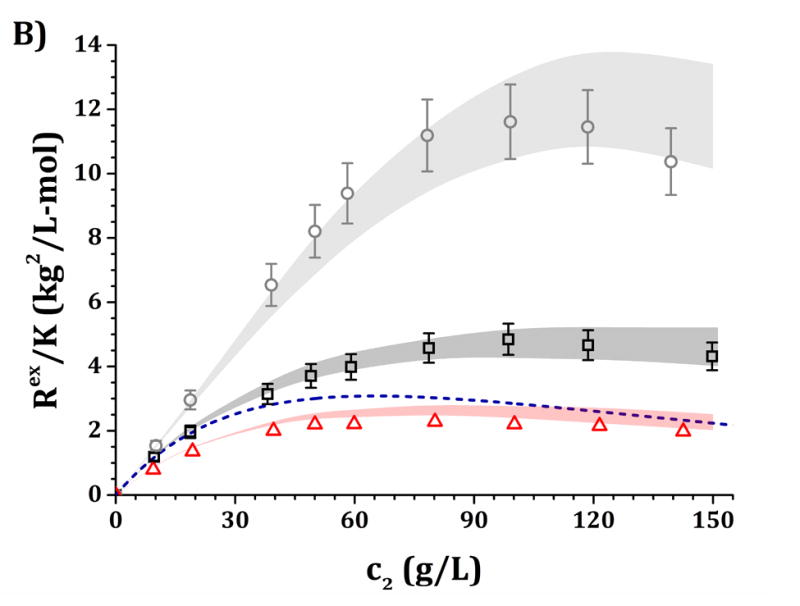
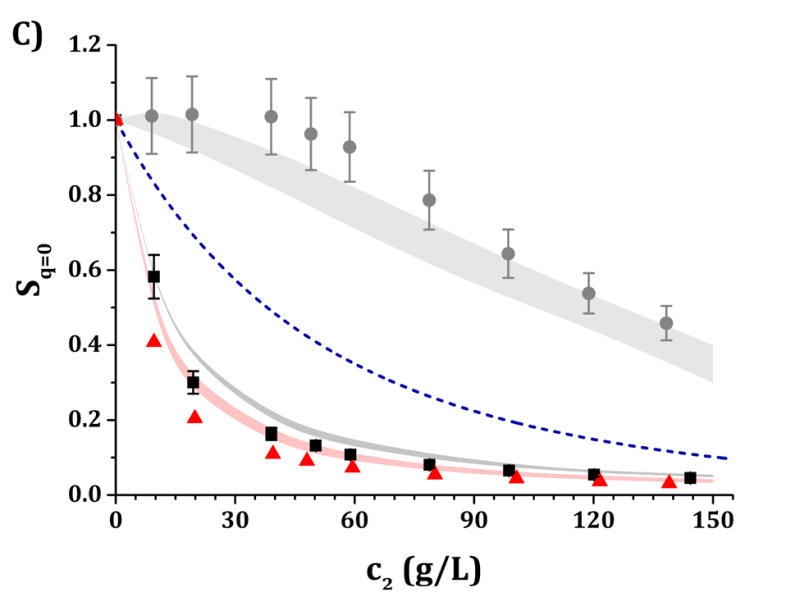
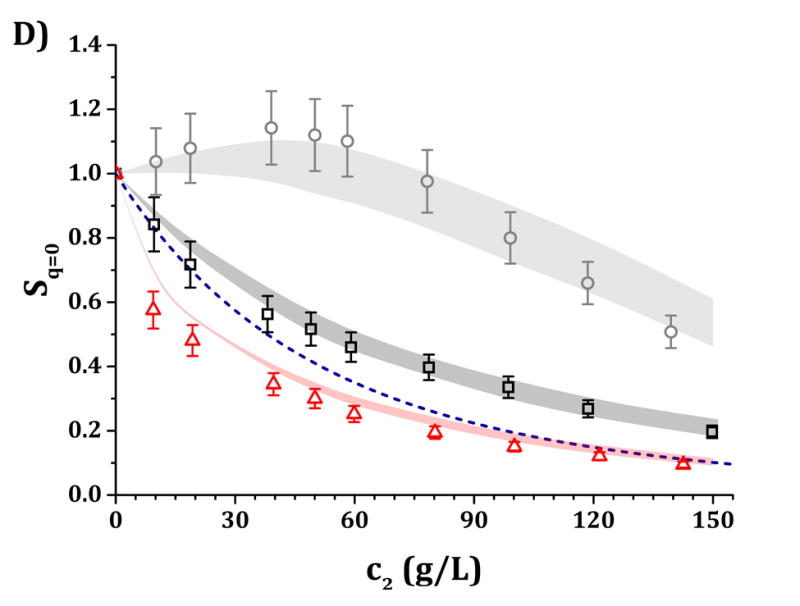
High-c2 predictions of Rex/K and Sq=0 from low-c2 parameters with the HEXA model shown in Fig. 4, for pH 5 (panels A and C) and pH 6.5 (panels B and D) and for buffer-only (black squares), 5% w/w sucrose (red triangles) and 100 mM NaCl (gray circles). The symbols represent the experimental data from insets in Fig. 3 while shaded areas represent the model predictions. The blue dashed line represents the steric-only behavior.
Figure 7.
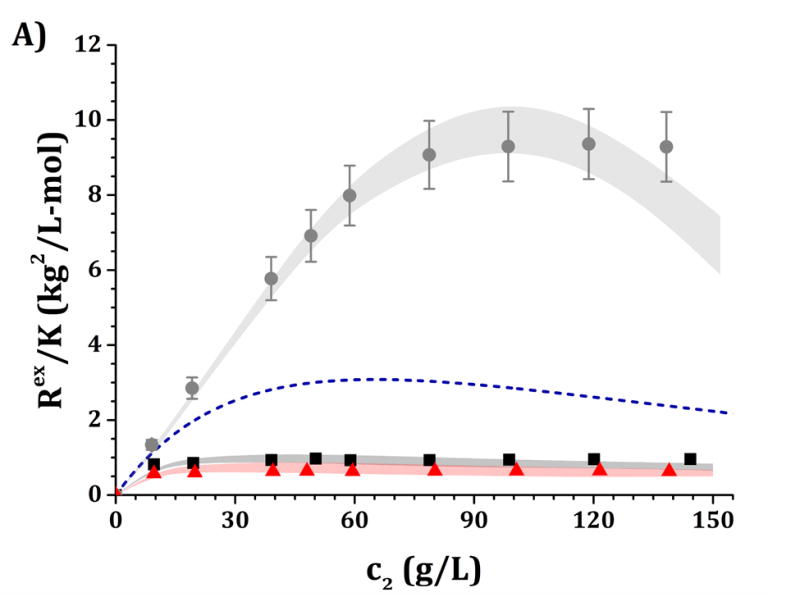
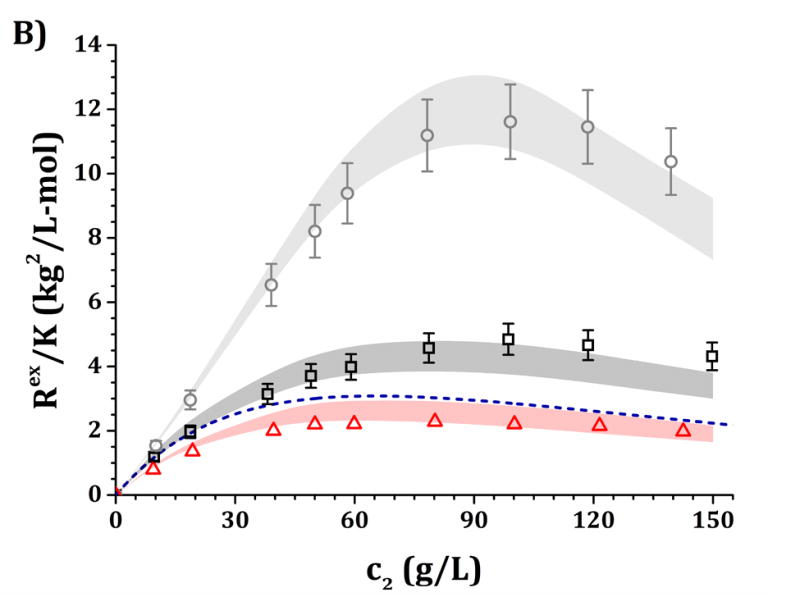
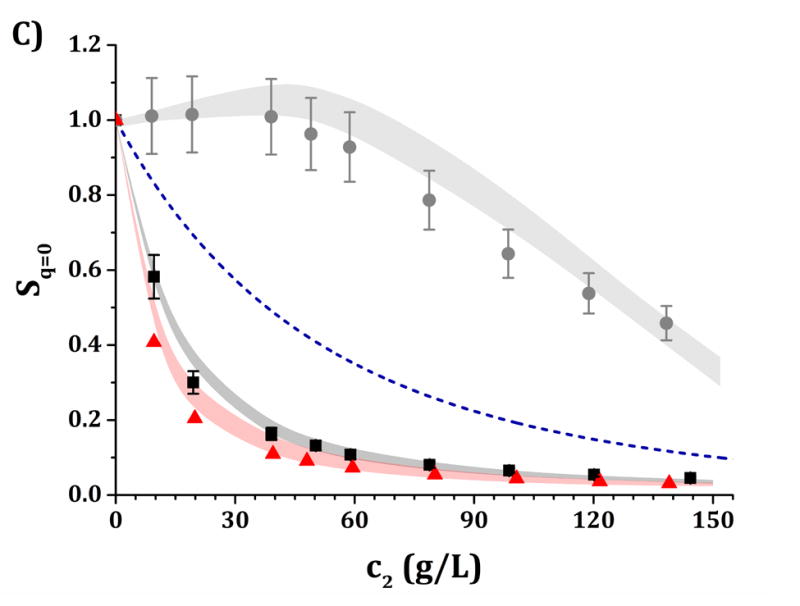
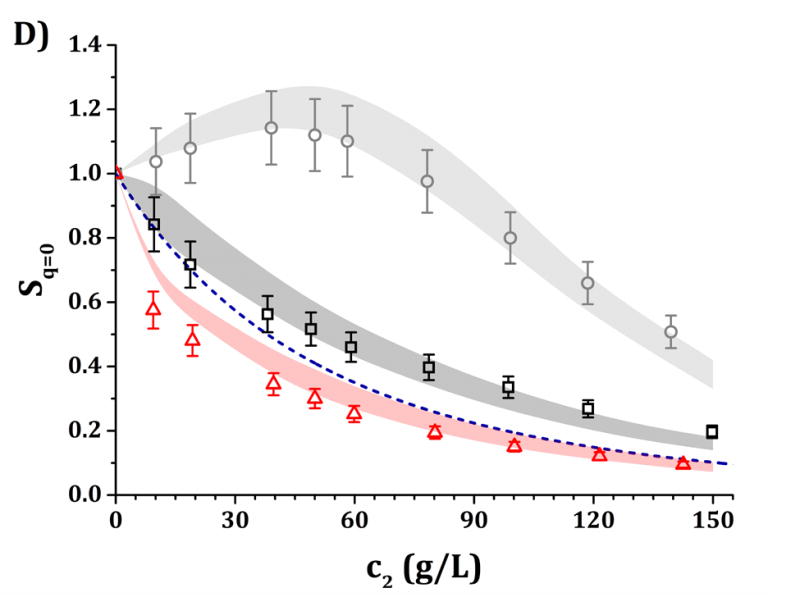
High-c2 predictions of Rex/K and Sq=0 from low-c2 parameters with the DODECA model shown in Fig. 5, for pH 5 (panels A and C) and pH 6.5 (panels B and D) and for buffer-only (black squares), 5% w/w sucrose (red triangles) and 100 mM NaCl (gray circles). The symbols represent the experimental data from insets in Fig. 3 while shaded areas represent the model predictions. The blue dashed line represents the steric-only behavior.
Figure 8 shows values as a function of in acetate, pH 5 (panel A), and in histidine, pH 6.5 (panel B); with sucrose as the added excipient (component 3). For both panels, the addition of sucrose leads to a monotonic and linear decrease in protein partial specific volume (i.e., a negative slope for vs ). The values for fitted intercepts using equation 3 are 0.708 ± 0.006 mL/g for pH 5 and 0.709 ± 0.004 mL/g for pH 6.5. Similarly, the slopes are equal to −1.0 ± 0.1 mL/g for pH 5, and −1.08 ± 0.06 mL/g for pH 6.5. Both pH values returned the same slope and intercept values within their statistical uncertainties. The negative slopes clearly indicate a similar level of preferential accumulation or solvation by sucrose around the protein surface for both pH values.
Figure 8.
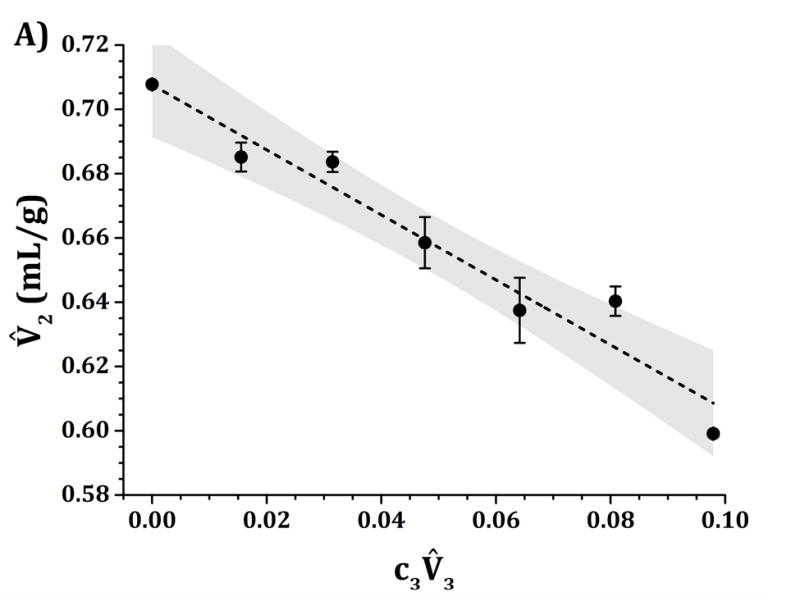
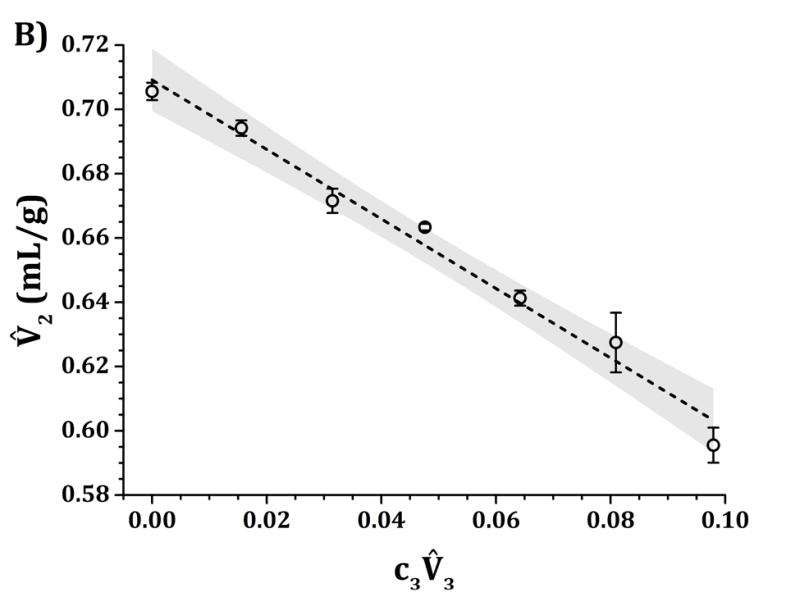
IgG1 values as a function of sucrose concentrations at 25 °C and pH 5 (panel A) and pH 6.5 (panel B) for quaternary solutions of water, IgG1, sucrose and 10 mM acetate (panel A) or histidine (panel B) buffer. The dashed lines represent the linear fits to extract (G12-G23) from equation 3 with the assumption that is negligible. Shaded areas represent the 95% confidence level of each individual linear fit.
DISCUSSION
Protein-protein “weak” interactions are mediated by the solution environment the protein is subjected to. These interactions have three main contributions: sterics or excluded volume effects (repulsive); short-ranged non-electrostatic van der Waals interactions and hydration/solvation effects (net attractive or repulsive); and electrostatic interactions (both attractive and repulsive). Among these, only the latter should be significantly affected by the solution ionic environment (via charge screening) if one neglects ion binding effects.12,23,43,45 Consequently, the decrease in B22/B22,ST values and plateau behavior that are observed as TIS increases in Fig. 3 can be attributed to a screening effect of strong charge-charge repulsions with the addition of NaCl, as described at least qualitatively by the Debye-Hückel theory.12,23,46 This agrees with previously published experimental behavior of a number of proteins as a function of ionic environment.7,11,12,51,52 Since B22/B22,ST converges towards values less than 1 at high-TIS conditions, there should be short-ranged non-electrostatic attractions present in the molecule to overcome the steric repulsions.23 Additionally, both pH 5 and 6.5 results converged towards equal B22/B22,ST values for TIS > 300 mM, suggesting that electrostatic contributions are completely screened and the solvation effects and van der Waals attractions present between the molecules are not affected by the differences in buffer chemistry and pH.12,39 Conversely, the difference in interactions at lower TIS values suggests different electrostatic behaviors with the change in both buffer-type and pH, going from strongly repulsive to mildly attractive (relative to steric-only interactions, B22/B22,ST = 1) as pH increases.12
It is commonly accepted that, for most proteins, the total effective protein charge approaches zero as the pH of the solution approaches the isoelectric point (pI) of the molecule. Consequently, the strength of electrostatic repulsions (caused by strong charge-charge repulsions) will decrease as the pH approaches the pI of the molecule. The pI of several IgG1 molecules have been reported to lie between 7.5 and 8.5, and the present molecule has a theoretical pI of 7.9 (calculated as explained in the Methods). Consequently, the decrease in repulsions with increased pH is expected based on a decrease in the total effective charge of the molecule (mostly due to deprotonated histidine residues at pH 6.5 in comparison to pH 5) and the change in the ion clouding/de-clouding that this might lead to.45,53,54 This is highlighted in Fig. 2, where the values of the theoretical charges decrease from pH 5 to 6.5, and in some case (as in the CH3 domain) this can cause a shift in sign. Since short-ranged non-electrostatic attractions are present at both pH values (net-attractions dominate at high TIS), this decrease in the effective protein charge with increasing pH would lead to stronger net-attractions (relative to sterics) at low TIS, as seen in Fig. 3.
Collecting B22/B22,ST data as a function of TIS allows one to gain insights into two of the main contributions to protein-protein solution interactions: (a) the strength and sign of net electrostatic interactions (observed at low TIS) and (b) the strength of short-ranged non-electrostatic attractions (observed at high TIS).12,23 This is better visualized in the insets of Figs. 4 and 5, where data shown in Fig. 3 were used to tune the model parameters for the HEXA (Fig. 4) and DODECA (Fig. 5) models as described above. In Figs. 4 and 5, all surface response plots show a funnel-like behavior, where a small subset of [εSR, ψ] pairs is capable of accurately modeling the experimental data within a 20% ARD. Additionally, a smaller subset of [εSR, ψ] pairs was also found to model the experimental data to much higher resolution in some situations (ARD ~ 0%) when the uncertainty in the experimental data is taken into account. These results showed the capability of the present CG models to quantitatively capture two-particle behavior as a function of TIS and at low c2. Additionally, Figs. 4 and 5 show that the currently proposed electrostatic interaction model is capable of accurately modeling the B22/B22,ST behavior from low to high TIS as well as the plateau in B22/B22,ST values that occurs at high TIS (above 300 mM).
Differences in the values of the parameters within the gray regions are observed when comparing insets in Figs. 4 and 5 across pH (panels A vs C, and B vs D), added sucrose (panels A vs B, and C vs D) and model-type (Fig. 4 vs Fig. 5). By comparing results across pH values for both Figs. 4 and 5, one observes that the only parameter that is significantly affected is ψ, as it shifts from ~0.35 at pH 5 to ~0.65 at pH 6.5 for the HEXA model, and from ~0.65 at pH 5 to ~1.0 at pH 6.5 for the DODECA model. This increase in ψ can potentially be explained by a decrease in ion binding due to smaller net charges in the protein molecule (see Fig. 2 and discussion above) and the possible changes in binding affinity of the ions.45 Consequently, the accumulation of ions around the protein may change with changes in pH, causing an increase in ψ as the solution charges approach their theoretical value since ψ → 1 as qi,eff → qi. From the results in Fig. 4 and 5, this change in ψ is only observed across changes in pH, as ψ remains constant when comparing across sucrose content (panels A vs B, and C vs D). This suggests that the addition of sucrose should only induce a significant non-electrostatic effect to the protein solution behavior. This is also observed in the experimental data (Fig. 3), where the values of B22/B22,ST are equal for both buffer-only and buffer + sucrose formulations at low TIS, but diverge as TIS increases. Comparing panels A and B, and C and D in Fig 3., the addition of sucrose correlates with a decrease in the value of εSR. For the HEXA model, εSR goes from ~1.1 kBT for buffer-only conditions to ~1.0 kBT for buffer + sucrose conditions for both pH values (Fig. 4). Similarly, for the DODECA model the resulting value shifts from ~0.72 kBT to ~0.64 kBT (Fig. 5). This decrease in εSR and increase in B22/B22,ST at high TIS with added sucrose suggests changes in the hydration shells of the protein in the form of protein-sucrose interactions, and this will be discussed further below.
Comparing Figs. 4 and 5 also shows that the εSR values within the gray areas are always lower in magnitude for the DODECA model (0.62 - 0.78 kBT) than for the HEXA model (1.0 -1.2 kBT) for all simulated formulations in Table 1. This is due to the decrease in the number of beads/domains by moving from the DODECA to the HEXA model, analogous to previous work with globular proteins.23,55 Conversely, the magnitude of ψ increases in the DODECA model in comparison to the HEXA model (see numbers above). Although the discussion for εSR in terms of the differences in number of domains for HEXA vs DODECA also applies to ψ, changes in the values of the charges also play a relevant role in this case. As expected, charges in the HEXA model are effectively twice the magnitude of those in the DODECA model (see Table 2 and Fig. 2). Charge-charge interactions were modeled via equation 5, where the electrostatic potential energy is proportional to the product of the charges. Consequently, doubling the value of the charges (by going from DODECA to HEXA) would induce an increase in potential energy by a factor of 4, which can compensate and overcome the decrease in the number of simulated domains/beads (from 12 to 6 in this case).
The present CG models also locate the charges in the center of the bead/domain in contrast to the real protein charges on the surface. A larger charge can be conducive of stronger counter ion accumulation due to strong charge-charge attractions and territorial ion accumulation, so lower ψ values are expected for more coarse-grained (less structurally detailed) models. Although this is intended to represent ion accumulation on protein solutions, the reader must be cautious that both εSR and ψ values used in this work and for these CG models are model specific, and likely will differ if one changes the structural resolution of the models (either higher or lower resolution).12,23,55 In addition, one must realize that ψ is a “lumped” parameter that attempts to capture deviations from theoretical and true net charge that could have origins from multiple sources (e.g., not only territorial ions but also hydration effects or ion-specific effects). As such, caution is needed to avoid over-interpreting the underlying causes for ψ values that deviate significantly from 1.
It is anticipated that the same qualitative behavior discussed above might apply at higher c2. At pH 5, both buffer-only and buffer + sucrose excess Rayleigh and Sq=0 profiles are observed to lie below the steric-only behavior (net-repulsive, see Figs. 3, 6 and 7). This agrees with the low-c2 behavior as B22/B22,ST ~ 1.8 (cf., Fig. 3). Nevertheless, buffer + sucrose conditions were observed to be more repulsive (lower Sq=0 and Rex/K vs c2 values) than buffer-only conditions, and this deviation is more pronounced as c2 increases. This does not correlate with low-c2 measurements, as both pH conditions resulted in equal B22/B22,ST values within their experimental uncertainties (Fig. 3A). At pH 6.5, the buffer-only conditions remain net-attractive at high c2, but sucrose conditions are net-repulsive between 10 and 120 g/L, converging towards the steric-only behavior at higher c2. These results could not be predicted from low-c2 information alone, as all measured B22/B22,ST results were net-attractive at pH 6.5, with equal B22/B22,ST results for sucrose and buffer-only formulations at low TIS (see discussion above). For all formulations with 100 mM NaCl, the excess Rayleigh profiles show net-attractive behavior for both pH values, with stronger attractions at pH 6.5 in comparison to pH 5 and in good agreement with the results at low c2.
Although there are an increasing number of studies that focus on experimentally correlating low-c2 measurements with high-c2 protein physicochemical behavior, results in Fig. 3 highlight some of the short-comings of these approaches, as interactions and solution behavior might change as the solution transitions from low to high c2. As shown in Figs. 6 and 7, the changes in Sq=0 are not monotonic (not constant G22). This leads to weaker net-attractions relative to those seen only at low c2. This is of greater relevance during screening of drug candidates and formulations during early stages of development, where limited access to protein material necessitates measurements at low-c2 (dilute solution conditions). As the solution is concentrated, the solution behavior is expected to be influenced heavily by the steric (shape-based) contributions based on general arguments from the statistical mechanics of liquids.23,28,56 Thus, the shape of the molecule is expected to greatly affect the way MAb molecules interact under concentrated conditions.23 The addition of short-ranged interactions (either attractive or repulsive) mediates preferentially interacting domains, which might lead to increases in viscosity as reported in previous work.7,12,57,58 These two effects (enhanced short-ranged interactions and packing behavior) are reasonably well captured by the HEXA and DODECA model.
The results in Figs. 4 and 5 allow one to obtain a small family of [εSR, ψ] pairs that can be used to evaluate the predictive capabilities of the HEXA and DODECA models at high-c2 conditions as shown in Figs. 6 and 7. This is highlighted in Table 4, where the [εSR, ψ] pairs that best predict the high-c2 SLS data lie within the parameter space obtained during the low-c2 parameter tuning (cf., insets in Figs. 4–5). The results in Figs. 6–7 show that both models are capable of accurately predicting, not simply regressing, excess Rayleigh scattering profiles up to 150 g/L of protein concentration. Small qualitative difference can be observed between the results for the HEXA (Fig. 6) and DODECA (Fig. 7) models. While the HEXA model results in smaller deviations at pH 5 than the DODECA model, the opposite is observed at pH 6.5. At pH 5, there is a noticeable deviation for values above 120 g/L for the DODECA model, where the predicted Rex/K profiles qualitatively deviate with increasing c2 from the experimental data (Fig. 7A). This behavior might be caused by the geometry of the models and the ease of packing of each model. The HEXA model locates all of its beads on a single plane while the DODECA model increases the complexity of the model by extending it to two planes (see Fig. 1). This increase in geometrical complexity potentially adds stronger packing limitations at high c2 for the DODECA model. Additionally, these two models were simulated by neglecting the flexibility of the hinge region due to limited access to data that can be used to refine such behavior (e.g., SANS or SAXS). The hinge flexibility might correct for these discrepancies at higher c2 for the DODECA model by easing the packing constraints of such model as suggested in previous work on simpler MAb models.16,23 However, the addition of a flexible hinge would pose additional computational challenges in terms of convergence or precision of the simulations. That would be further exacerbated if one permitted full chain flexibility and local unfolding in the simulations.16,59,60
Finally, sucrose has been historically categorized as a preferentially excluded excipient.38,42 Preferential exclusion from the protein surface causes a reduction in the available free-volume for the protein molecules. This induces stronger attractions between proteins driven by the steric repulsion between protein and sucrose molecules (in the form of depletion forces). This behavior has been identified as the main mechanism behind protein flocculation and “salting-out” in the presence of preferentially excluded excipients. However, results presented in Figs. 3–7 show the opposite behavior. Stronger repulsions were observed for solution with sucrose than those when sucrose was absent. This increase in repulsions was caused by weaker short-ranged non-electrostatic attractions, as exemplified by the fact that the magnitude of εSR obtained from parameter tuning was effectively lower in magnitude for sucrose conditions than those without sucrose (see discussion above) at both tested pH values. Similarly, results in Fig. 8 (negative slopes at both pH 5 and 6.5) suggest preferential accumulation or solvation by sucrose around the protein surface, in agreement with previously reported results where sucrose was also found to solvate proteins.39
Consequently, by combining the results from Figs. 3–8 along with the simulations results offered by the CG modeling, one can hypothesize how addition of sucrose induces stronger repulsions between protein molecules. The accumulation of sucrose around the protein surface (i.e., protein solvation by sucrose molecules) might be affecting the way proteins interact through two different mechanism. First, the solvation by sucrose around the protein surface displaces water molecules from the hydration layers (protein dehydration), decreasing the gain in solution free energy upon protein-protein close contact.31 Second, sucrose has a larger molecular diameter than water,39 and a protein solvated by sucrose might experience an increase in its effective excluded volume, increasing the strength of apparent steric repulsions between proteins. Both contributions are expected to be present upon addition of sucrose, but the current experimental data does not allow one to resolve which mechanism might be dominating the observed solution behavior.
SUMMARY
Static light scattering was used to quantify “weak” protein-protein interactions of an IgG1 molecule as a function of protein concentration for a range of pH, TIS values, and sucrose concentration. Experimental measurements showed both net-repulsive and net-attractive protein interactions at low TIS, and at low- to high-c2 conditions. Two coarse-grained molecular models were tested to evaluate their potential to predict excess Rayleigh profiles and zero-q structure factors at high c2. Additional high-precision density measurements were used to further assess the non-electrostatic effect of adding sucrose to the solution. Low-concentration results showed that the IgG1 molecule exhibits net-repulsive behavior at low TIS and pH 5, which transitions to net-attractive behavior as the solution TIS increases. At pH 6.5, the antibody showed weakly net-attractive behavior from low to high TIS, resulting in statistically equal values at both pH conditions for high TIS (> 300 mM). For all measured pH and TIS conditions, the addition of 5% w/w sucrose to the solution induced weaker net-attractions with increasing TIS. This behavior was also observed at high c2, where formulations with 5% w/w sucrose always resulted in net-repulsive behavior at low TIS. This is counter to traditional expectations based on depletion interactions, in that preferentially excluded solutes drive protein-protein attractions, not repulsions. For conditions without sucrose present, buffer-only formulations shifted from net-repulsive behavior (relative to steric-only interactions) at pH 5 to net-attractive at pH 6.5, while formulations with 100 mM NaCl resulted in net-attractive behavior at both pH values.
In terms of model predictions from low to high c2, the quantitative differences were not statistically significant, and therefore both models could be used to accurately predict high-c2 behavior depending on the requirements of the user (e.g., computational burden and molecular features). Finally, the combination of experimental and simulated SLS data with experimental partial specific volume data indicated preferential accumulation (solvation) of sucrose around the protein surface. This led to stronger repulsion between protein molecules observed at both low and high c2. The simulations results showed that both CG models, the HEXA and DODECA models, were able to quantitatively or semi-quantitatively predict the experimental data based solely on parameters obtained by combining B22/B22,ST vs TIS experimental and simulated data collected at low c2.
Acknowledgments
C.C.R. and C.J.R. gratefully acknowledge Bristol-Myers Squibb, the National Science Foundation (CHEM 1213728), and the National Institutes of Health (R01 EB006006) for financial support.
Footnotes
Publisher's Disclaimer: This is a PDF file of an unedited manuscript that has been accepted for publication. As a service to our customers we are providing this early version of the manuscript. The manuscript will undergo copyediting, typesetting, and review of the resulting proof before it is published in its final citable form. Please note that during the production process errors may be discovered which could affect the content, and all legal disclaimers that apply to the journal pertain.
References
- 1.Wang W, Roberts CJ. Aggregation of Therapeutic Proteins. John Wiley & Sons, Inc; 2010. [Google Scholar]
- 2.Uchiyama S. Liquid formulation for antibody drugs. Biochim Biophys Acta - Proteins Proteomics. 2014;1844(11):2041–2052. doi: 10.1016/j.bbapap.2014.07.016. [DOI] [PubMed] [Google Scholar]
- 3.Ghosh R, Calero-Rubio C, Saluja A, Roberts CJ. Relating Protein-Protein Interactions and Aggregation Rates From Low to High Concentrations. J Pharm Sci. 2016;105(3):1086–1096. doi: 10.1016/j.xphs.2016.01.004. [DOI] [PubMed] [Google Scholar]
- 4.Shire SJ, Shahrokh Z, Liu J. Challenges in the development of high protein concentration formulations. J Pharm Sci. 2004;93(6):1390–1402. doi: 10.1002/jps.20079. [DOI] [PubMed] [Google Scholar]
- 5.Weiss IVWF, Young TM, Roberts CJ. Principles, approaches, and challenges for predicting Protein Aggregation Rates and Shelf Life. J Pharm Sci. 2009;98(4):1246–1277. doi: 10.1002/jps.21521. [DOI] [PubMed] [Google Scholar]
- 6.Mitragotri S, Burke PA, Langer R. Overcoming the challenges in administering biopharmaceuticals: formulation and delivery strategies. Nat Rev Drug Discov. 2014;13(9):655–672. doi: 10.1038/nrd4363. [DOI] [PMC free article] [PubMed] [Google Scholar]
- 7.Connolly BD, Petry C, Yadav S, Demeule B, Ciaccio N, Moore JMR, Shire SJ, Gokarn YR. Weak interactions govern the viscosity of concentrated antibody solutions: high-throughput analysis using the diffusion interaction parameter. Biophys J. 2012;103(1):69–78. doi: 10.1016/j.bpj.2012.04.047. [DOI] [PMC free article] [PubMed] [Google Scholar]
- 8.Raut AS, Kalonia DS. Pharmaceutical Perspective on Opalescence and Liquid-Liquid Phase Separation in Protein Solutions. Mol Pharm. 2016;13(5):1431–1444. doi: 10.1021/acs.molpharmaceut.5b00937. [DOI] [PubMed] [Google Scholar]
- 9.Raut AS, Kalonia DS. Opalescence in Monoclonal Antibody Solutions and Its Correlation with Intermolecular Interactions in Dilute and Concentrated Solutions. J Pharm Sci. 2015;104(4):1263–1274. doi: 10.1002/jps.24326. [DOI] [PubMed] [Google Scholar]
- 10.Neergaard MS, Kalonia DS, Parshad H, Nielsen AD, Møller EH, van de Weert M. Viscosity of high concentration protein formulations of monoclonal antibodies of the IgG1 and IgG4 subclass - prediction of viscosity through protein-protein interaction measurements. Eur J Pharm Sci. 2013;49(3):400–410. doi: 10.1016/j.ejps.2013.04.019. [DOI] [PubMed] [Google Scholar]
- 11.Lilyestrom WG, Yadav S, Shire SJ, Scherer TM. Monoclonal antibody self-association, cluster formation, and rheology at high concentrations. J Phys Chem B. 2013;117(21):6373–6384. doi: 10.1021/jp4008152. [DOI] [PubMed] [Google Scholar]
- 12.Woldeyes MA, Calero-Rubio C, Furst EM, Roberts CJ. Predicting Protein Interactions of Concentrated Globular Protein Solutions Using Colloidal Models. J Phys Chem B. 2017;121(18):4756–4767. doi: 10.1021/acs.jpcb.7b02183. [DOI] [PubMed] [Google Scholar]
- 13.Yearley EJ, Godfrin PD, Perevozchikova T, Zhang H, Falus P, Porcar L, Nagao M, Curtis JE, Gawande P, Taing R, Zarraga IE, Wagner NJ, Liu Y. Observation of small cluster formation in concentrated monoclonal antibody solutions and its implications to solution viscosity. Biophys J. 2014;106(8):1763–1770. doi: 10.1016/j.bpj.2014.02.036. [DOI] [PMC free article] [PubMed] [Google Scholar]
- 14.Liu Y, Chen W-R, Chen S-H. Cluster formation in two-Yukawa fluids. J Chem Phys. 2005;122(4):44507. doi: 10.1063/1.1830433. [DOI] [PubMed] [Google Scholar]
- 15.Yearley EJ, Zarraga IE, Shire SJ, Scherer, Thomas M, Gokarn Y, Wagner NJ, Liu Y. Small-angle neutron scattering characterization of monoclonal antibody conformations and interactions at high concentrations. Biophys J. 2013;105(3):720–731. doi: 10.1016/j.bpj.2013.06.043. [DOI] [PMC free article] [PubMed] [Google Scholar]
- 16.Castellanos MM, Clark NJ, Watson MC, Krueger S, McAuley A, Curtis JE. Role of Molecular Flexibility and Colloidal Descriptions of Proteins in Crowded Environments from Small-Angle Scattering. J Phys Chem B. 2016;120(49):12511–12518. doi: 10.1021/acs.jpcb.6b10637. [DOI] [PubMed] [Google Scholar]
- 17.Courtenay ES, Capp MW, Anderson CF, Record MT., Jr Vapor Pressure Osmometry Studies of Osmolyte - Protein Interactions : Implications for the Action of Osmoprotectants in Vivo and for the Interpretation of “ Osmotic Stress ” Experiments in Vitro. Biochemistry. 2000;39(15):4455–4471. doi: 10.1021/bi992887l. [DOI] [PubMed] [Google Scholar]
- 18.Schuck P. Analytical Ultracentrifugation as a Tool for Studying Protein Interactions. Biophys Rev. 2013;5(2):159–171. doi: 10.1007/s12551-013-0106-2. [DOI] [PMC free article] [PubMed] [Google Scholar]
- 19.Li L, Kumar S, Buck PM, Burns C, Lavoie J, Singh SK, Warne NW, Nichols P, Luksha N, Boardman D. Concentration dependent viscosity of monoclonal antibody solutions: Explaining experimental behavior in terms of molecular properties. Pharm Res. 2014;31(11):3161–3178. doi: 10.1007/s11095-014-1409-0. [DOI] [PubMed] [Google Scholar]
- 20.Blanco MA, Sahin E, Li Y, Roberts CJ. Reexamining protein-protein and protein-solvent interactions from Kirkwood-Buff analysis of light scattering in multi-component solutions. J Chem Phys. 2011;134(22):225103. doi: 10.1063/1.3596726. [DOI] [PMC free article] [PubMed] [Google Scholar]
- 21.Blanco MA, Perevozchikova T, Martorana V, Manno M, Roberts CJ. Protein-protein interactions in dilute to concentrated solutions: α-Chymotrypsinogen in acidic conditions. J Phys Chem B. 2014;118(22):5817–5831. doi: 10.1021/jp412301h. [DOI] [PMC free article] [PubMed] [Google Scholar]
- 22.Blanco MA, Sahin E, Robinson AS, Roberts CJ. Coarse-Grained Model for Colloidal Protein Interactions, B22, and Protein Cluster Formation. J Phys Chem B. 2013;117(50):16013–16028. doi: 10.1021/jp409300j. [DOI] [PMC free article] [PubMed] [Google Scholar]
- 23.Calero-Rubio C, Saluja A, Roberts CJ. Coarse-Grained Antibody Models for “weak” Protein-Protein Interactions from Low to High Concentrations. J Phys Chem B. 2016;120(27):6592–6605. doi: 10.1021/acs.jpcb.6b04907. [DOI] [PubMed] [Google Scholar]
- 24.Xie G, Timasheff SN. Temperature dependence of the preferential interactions of ribonuclease A in aqueous co-solvent systems: thermodynamic analysis. Protein Sci. 1997;6(1):222–232. doi: 10.1002/pro.5560060124. [DOI] [PMC free article] [PubMed] [Google Scholar]
- 25.Barnett GV, Razinkov VI, Kerwin BA, Hillsley A, Roberts CJ. Acetate- and Citrate-Specific Ion Effects on Unfolding and Temperature-Dependent Aggregation Rates of Anti-Streptavidin IgG1. J Pharm Sci. 2016;105(3):1066–1073. doi: 10.1016/j.xphs.2015.12.017. [DOI] [PubMed] [Google Scholar]
- 26.Ferrenberg A, Swendsen R. New Monte Carlo technique for studying phase transitions. Phys Rev Lett. 1988 Dec;61:2635–2638. doi: 10.1103/PhysRevLett.61.2635. [DOI] [PubMed] [Google Scholar]
- 27.Awotwe-Otoo D, Agarabi C, Wu GK, Casey E, Read E, Lute S, Brorson KA, Khan MA, Shah RB. Quality by design: Impact of formulation variables and their interactions on quality attributes of a lyophilized monoclonal antibody. Int J Pharm. 2012;438(1–2):167–175. doi: 10.1016/j.ijpharm.2012.08.033. [DOI] [PubMed] [Google Scholar]
- 28.McQuarrie DA. Statistical Mechanics. University Science Books; 2000. [Google Scholar]
- 29.Ben-Naim A. Statistical Thermodynamics for Chemists and Biochemists. Plenum Press; 1992. [Google Scholar]
- 30.Schellman JA. The thermodynamics of solvent exchange. Biopolymers. 1994;34(8):1015–1026. doi: 10.1002/bip.360340805. [DOI] [PubMed] [Google Scholar]
- 31.Priya MH, Merchant S, Asthagiri D, Paulaitis ME. Quasi-chemical theory of cosolvent hydrophobic preferential interactions. J Phys Chem B. 2012;116(22):6506–6513. doi: 10.1021/jp301629j. [DOI] [PubMed] [Google Scholar]
- 32.Ben-Naim A, Navarro AM, Leal JM. A Kirkwood-Buff analysis of local properties of solutions. Phys Chem Chem Phys. 2008;10(18):2451–2460. doi: 10.1039/b716116f. [DOI] [PubMed] [Google Scholar]
- 33.Shimizu S. Estimation of excess solvation numbers of water and cosolvents from preferential interaction and volumetric experiments. J Chem Phys. 2004;120(10):4989–4990. doi: 10.1063/1.1646373. [DOI] [PubMed] [Google Scholar]
- 34.Godfrin PD, Zarraga IE, Zarzar J, Porcar L, Falus P, Wagner NJ, Liu Y. Effect of Hierarchical Cluster Formation on the Viscosity of Concentrated Monoclonal Antibody Formulations Studied by Neutron Scattering. J Phys Chem B. 2016;120(2):278–291. doi: 10.1021/acs.jpcb.5b07260. [DOI] [PubMed] [Google Scholar]
- 35.Castellanos MM, McAuley A, Curtis JE. Investigating Structure and Dynamics of Proteins in Amorphous Phases Using Neutron Scattering. Comput Struct Biotechnol J. 2017;15:117–130. doi: 10.1016/j.csbj.2016.12.004. [DOI] [PMC free article] [PubMed] [Google Scholar]
- 36.Vafaei S, Tomberli B, Gray CG. McMillan-Mayer theory of solutions revisited: Simplifications and extensions. J Chem Phys. 2014;141(15):154501. doi: 10.1063/1.4897980. [DOI] [PubMed] [Google Scholar]
- 37.Neal BL, Asthagiri D, Lenhoff AM. Molecular Origins of Osmotic Second Virial Coefficients of Proteins. Biophys J. 1998;75(5):2469–2477. doi: 10.1016/S0006-3495(98)77691-X. [DOI] [PMC free article] [PubMed] [Google Scholar]
- 38.Barnett GV, Razinkov VI, Kerwin BA, Blake S, Qi W, Curtis RA, Roberts CJ. Osmolyte Effects on Monoclonal Antibody Stability and Concentration-Dependent Protein Interactions with Water and Common Osmolytes. J Phys Chem B. 2016;120(13):3318–3330. doi: 10.1021/acs.jpcb.6b00621. [DOI] [PubMed] [Google Scholar]
- 39.Calero-Rubio C, Strab C, Barnett GV, Roberts CJ. Protein Partial Molar Volumes in Multi-Component Solutions From the Perspective of Inverse Kirkwood-Buff Theory. J Phys Chem B. 2017;121(24):5897–5907. doi: 10.1021/acs.jpcb.7b02553. [DOI] [PubMed] [Google Scholar]
- 40.Barnett GV, Razinkov VI, Kerwin BA, Blake S, Qi W, Curtis RA, Roberts CJ. Reply to Comment on “Osmolyte Effects on Monoclonal Antibody Stability and Concentration-Dependent Protein Interactions with Water and Common Osmolytes ” Reply to Comment on “Osmolyte Effects on Monoclonal Antibody Stability and Concentration- Dependent. J Phys Chem B. 2016;120(43):11333–11334. doi: 10.1021/acs.jpcb.6b06832. [DOI] [PubMed] [Google Scholar]
- 41.Rösgen J, Auton M. Comment on “Osmolyte Effects on Monoclonal Antibody Stability and Concentration-Dependent Protein Interactions with Water and Common Osmolytes. J Phys Chem B. 2016;120(43):11331–11332. doi: 10.1021/acs.jpcb.6b05602. [DOI] [PubMed] [Google Scholar]
- 42.Kendrick BS, Chang BS, Arakawa T, Peterson B, Randolph TW, Manning MC, Carpenter JF. Preferential exclusion of sucrose from recombinant interleukin-1 receptor antagonist: role in restricted conformational mobility and compaction of native state. Proc Natl Acad Sci U S A. 1997;94(22):11917–11922. doi: 10.1073/pnas.94.22.11917. [DOI] [PMC free article] [PubMed] [Google Scholar]
- 43.Bratko D, Striolo A, Wu JZ, Blanch HW, Prausnitz JM. Orientation-averaged pair potentials between dipolar proteins or colloids. J Phys Chem B. 2002;106(10):2714–2720. [Google Scholar]
- 44.Malmberg CG, Maryott AA. Dielectric constants of aqueous solutions of dextrose and sucrose. J Res Natl Bur Stand (1934) 1950;45(4):299. [Google Scholar]
- 45.Laue T, Demeler B. A postreductionist framework for protein biochemistry. Nat Chem Biol. 2011;7(6):331–334. doi: 10.1038/nchembio.575. [DOI] [PubMed] [Google Scholar]
- 46.Sandler SI. An Introduction to Applied Statistical Thermodynamics. John Wiley & Sons, Inc; 2010. [Google Scholar]
- 47.Po HN, Senozan NM. The Henderson-Hasselbalch Equation: Its History and Limitations. J Chem Educ. 2001;78(11):1499–1503. [Google Scholar]
- 48.Schultz AJ, Kofke DA. Virial coefficients of model alkanes. J Chem Phys. 2010;133(10):104101. doi: 10.1063/1.3486085. [DOI] [PubMed] [Google Scholar]
- 49.Frenkel D, Smit B. Understanding Molecular Simulation. In: Press A, editor. Vol Second Edi. 2002. [Google Scholar]
- 50.Shen V, Errington J. Metastability and instability in the Lennard-Jones fluid investigated by transition-matrix Monte Carlo. J Phys Chem B. 2004;108(51):19595–19606. [Google Scholar]
- 51.Kim N, Remmele RL, Liu D, Razinkov VI, Fernandez EJ, Roberts CJ. Aggregation of anti-streptavidin immunoglobulin gamma-1 involves Fab unfolding and competing growth pathways mediated by pH and salt concentration. Biophys Chem. 2013;172:26–36. doi: 10.1016/j.bpc.2012.12.004. [DOI] [PubMed] [Google Scholar]
- 52.Arzenšek D, Kuzman D, Podgornik R. Hofmeister Effects in Monoclonal Antibody Solution Interactions. J Phys Chem B. 2015;119(33):10375–10389. doi: 10.1021/acs.jpcb.5b02459. [DOI] [PubMed] [Google Scholar]
- 53.Zhang F, Skoda MWA, Jacobs RMJ, Zorn S, Martin RA, Martin CM, Clark GF, Weggler S, Hildebrandt A, Kohlbacher O, Schreiber F. Reentrant condensation of proteins in solution induced by multivalent counterions. Phys Rev Lett. 2008;101(14):148101. doi: 10.1103/PhysRevLett.101.148101. [DOI] [PubMed] [Google Scholar]
- 54.Roberts D, Keeling R, Tracka M, Van Der Walle CF, Uddin S, Warwicker J, Curtis R. The role of electrostatics in protein-protein interactions of a monoclonal antibody. Mol Pharm. 2014;11(7):2475–2489. doi: 10.1021/mp5002334. [DOI] [PubMed] [Google Scholar]
- 55.Grünberger A, Lai PK, Blanco MA, Roberts CJ. Coarse-grained modeling of protein second osmotic virial coefficients: Sterics and short-ranged attractions. J Phys Chem B. 2013;117(3):763–770. doi: 10.1021/jp308234j. [DOI] [PubMed] [Google Scholar]
- 56.Zimmerman S, Minton A. Macromolecular crowding: biochemical, biophysical, and physiological consequences. Annu Rev Biophys. 1993:27–65. doi: 10.1146/annurev.bb.22.060193.000331. [DOI] [PubMed] [Google Scholar]
- 57.Schmit JD, He F, Mishra S, Ketchem RR, Woods CE, Kerwin BA. Entanglement model of antibody viscosity. J Phys Chem B. 2014;118(19):5044–5049. doi: 10.1021/jp500434b. [DOI] [PubMed] [Google Scholar]
- 58.Tomar DS, Kumar S, Singh SK, Goswami S, Li L. Molecular basis of high viscosity in concentrated antibody solutions: Strategies for high concentration drug product development. MAbs. 2016;8(2):216–228. doi: 10.1080/19420862.2015.1128606. [DOI] [PMC free article] [PubMed] [Google Scholar]
- 59.Harris LJ, Skaletsky E, McPherson A. Crystallographic structure of an intact IgG1 monoclonal antibody. J Mol Biol. 1998;275(5):861–872. doi: 10.1006/jmbi.1997.1508. [DOI] [PubMed] [Google Scholar]
- 60.Bongini L, Fanelli D, Piazza F, De Los Rios P, Sandin S, Skoglund U. Freezing immunoglobulins to see them move. Proc Natl Acad Sci U S A. 2004;101:6466–6471. doi: 10.1073/pnas.0400119101. [DOI] [PMC free article] [PubMed] [Google Scholar]


