
Figure 4. Main panels.
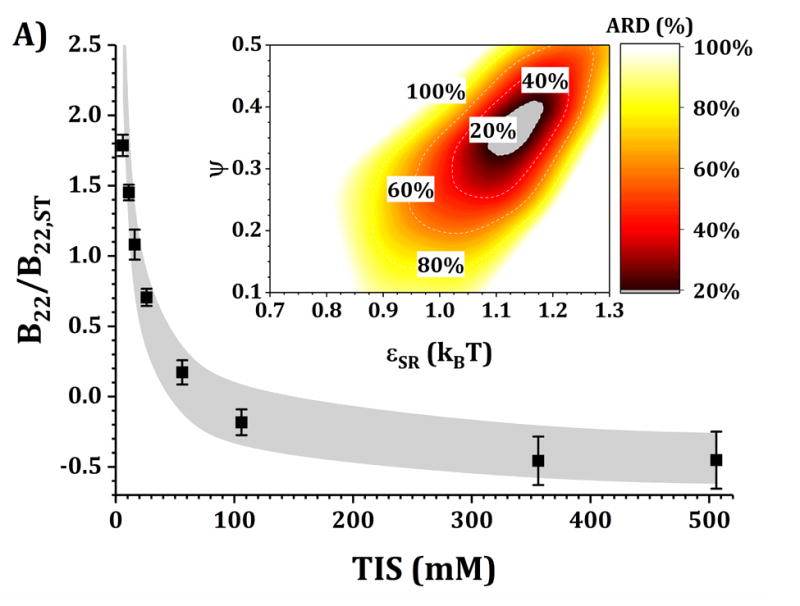
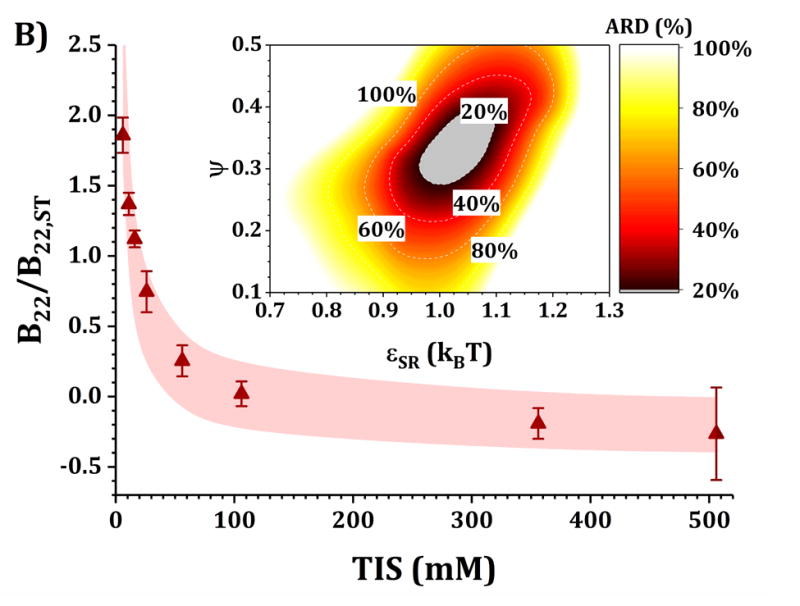
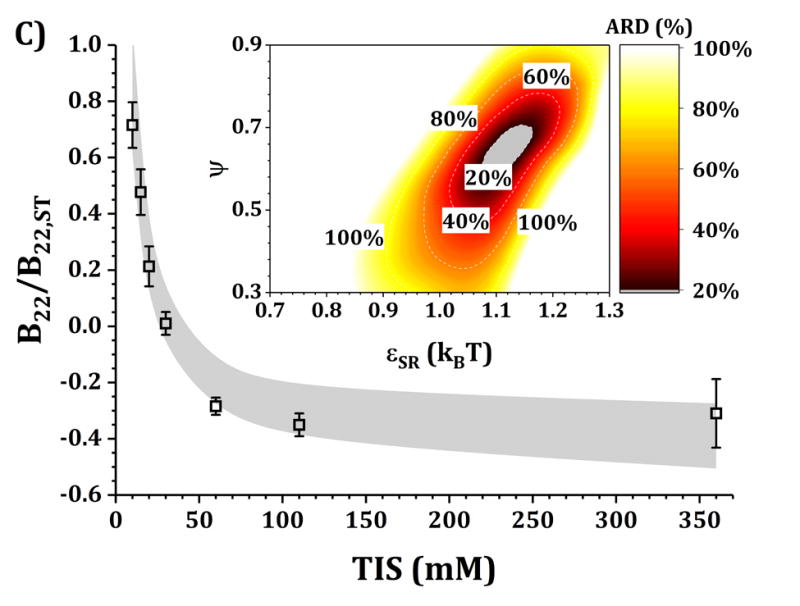
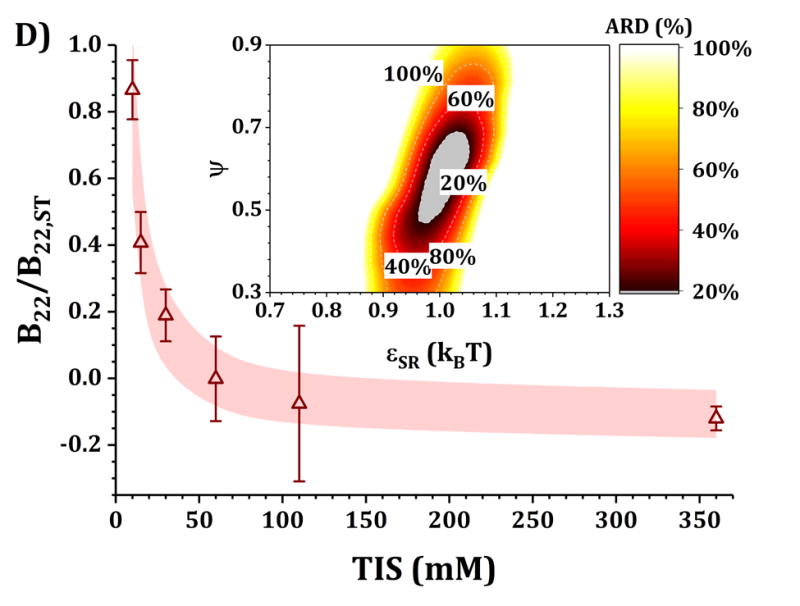
comparison of B22/B22,ST as a function of TIS between experimental (symbols) and simulated values (shaded areas) using the HEXA model at pH 5 for buffer-only (panel A) and 5% w/w added sucrose (panel B) and at pH 6.5 for buffer-only (panel C) and 5% w/w added sucrose (panel D). Inset: surface response of ARD values as a function of εSR and ψ for each respective formulation.