
Figure 6.
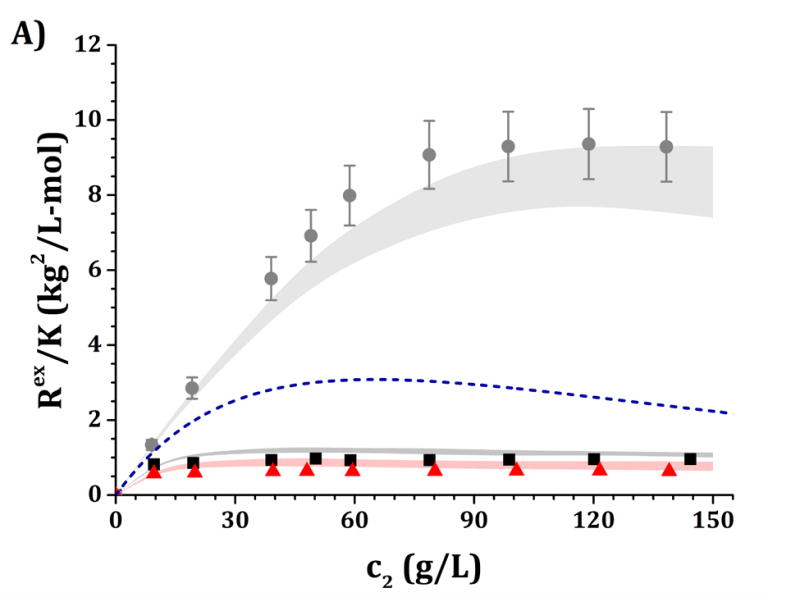
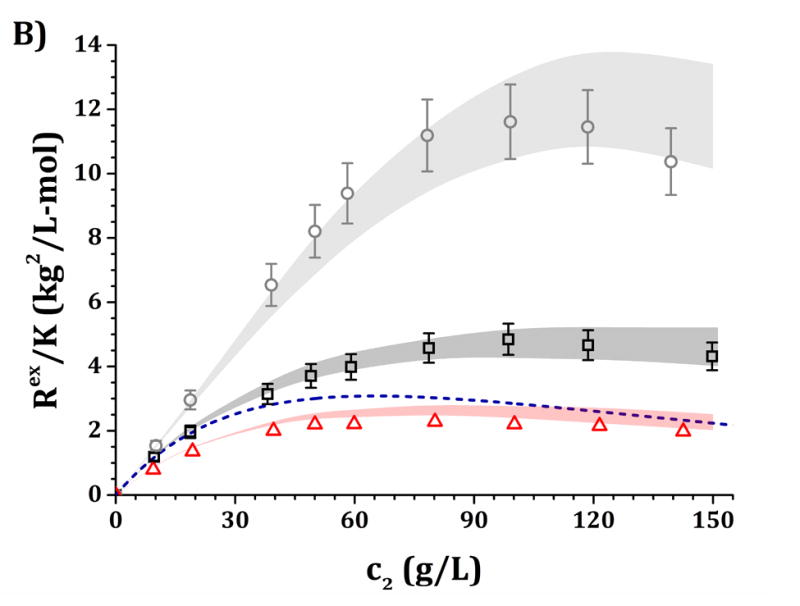
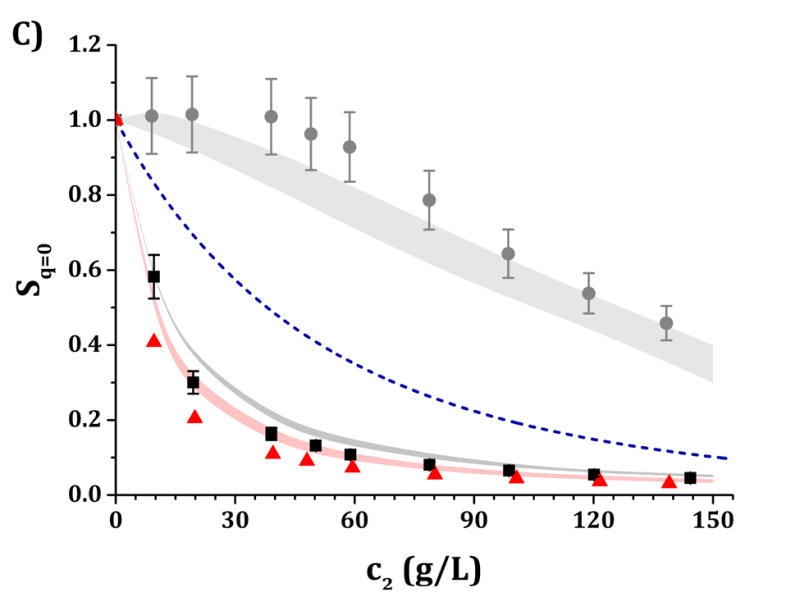
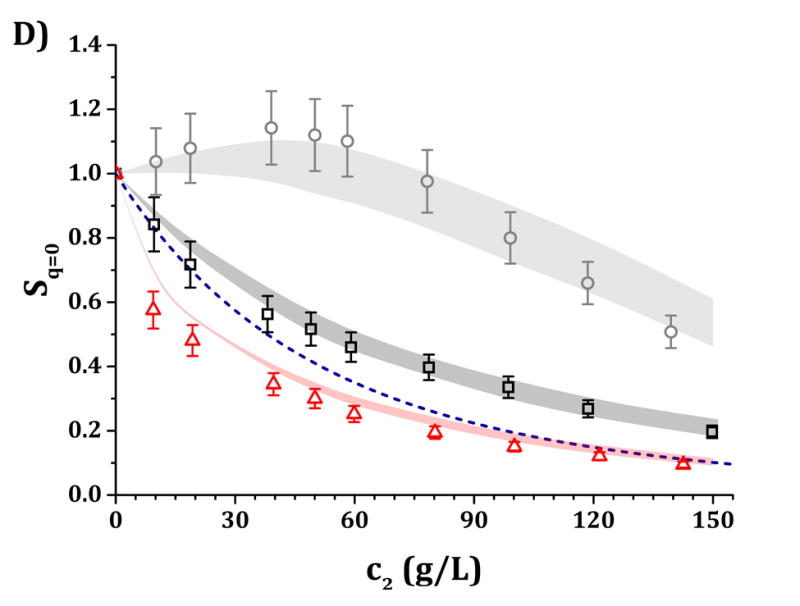
High-c2 predictions of Rex/K and Sq=0 from low-c2 parameters with the HEXA model shown in Fig. 4, for pH 5 (panels A and C) and pH 6.5 (panels B and D) and for buffer-only (black squares), 5% w/w sucrose (red triangles) and 100 mM NaCl (gray circles). The symbols represent the experimental data from insets in Fig. 3 while shaded areas represent the model predictions. The blue dashed line represents the steric-only behavior.