
Figure 8.
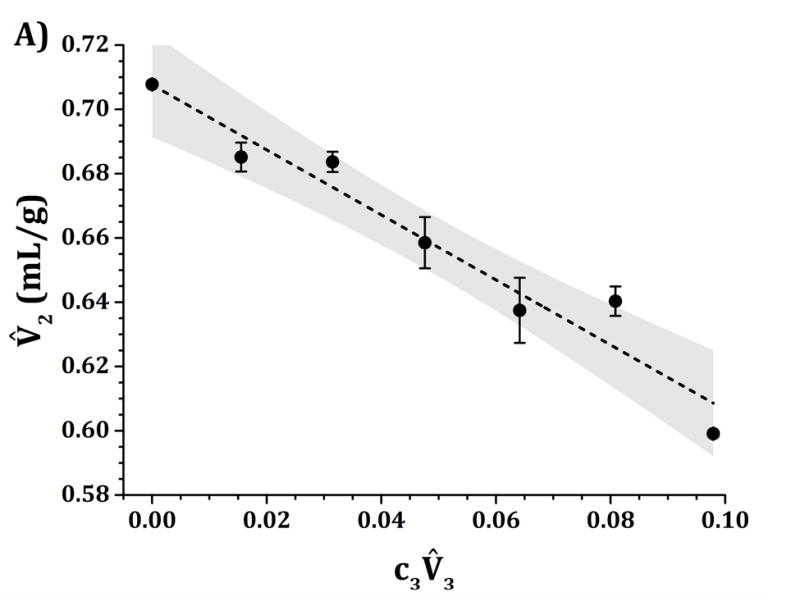
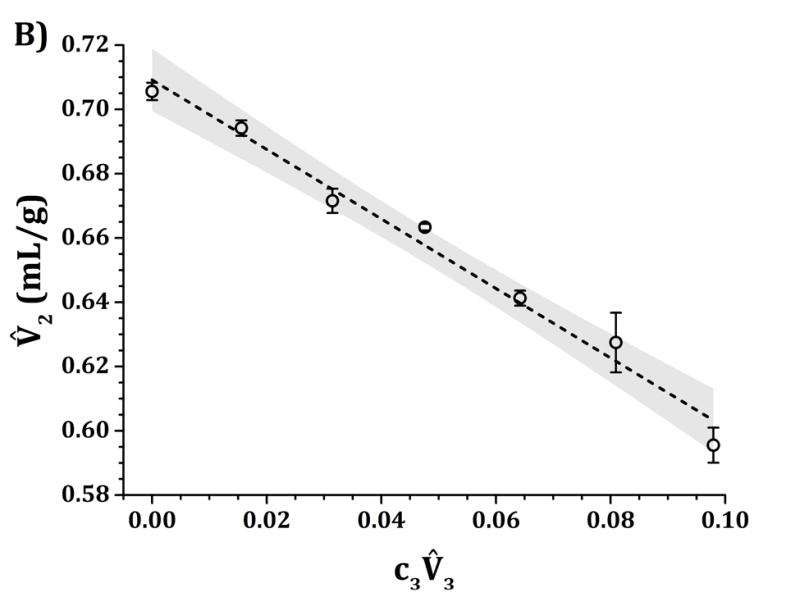
IgG1 values as a function of sucrose concentrations at 25 °C and pH 5 (panel A) and pH 6.5 (panel B) for quaternary solutions of water, IgG1, sucrose and 10 mM acetate (panel A) or histidine (panel B) buffer. The dashed lines represent the linear fits to extract (G12-G23) from equation 3 with the assumption that is negligible. Shaded areas represent the 95% confidence level of each individual linear fit.