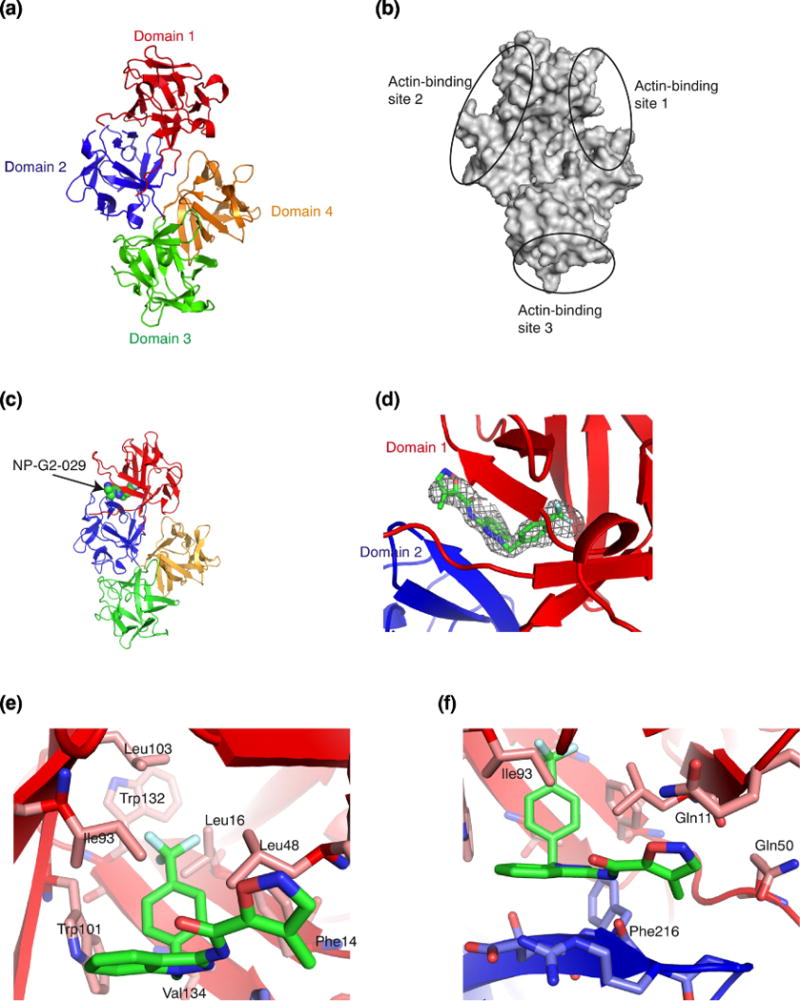
Figure 2.

Crystal structure of the complex of fascin and the small-molecule inhibitor NP-G2-029. (a) Crystal structure of wild-type human fascin shows the relative orientation of the four β-trefoil domains (marked by 4 different colors) of one fascin molecule. (b) Diagram of fascin shows the locations of the three possible actin-binding sites based on the mutagenesis data. (c) X-ray crystal structure of the complex of fascin and NP-G2-029. NP-G2-029 occupies the actin- binding site 2. (d) The electron density map (2Fo-Fc at sigma level of 1.5) for NP-G2-029. (e and f) The binding pocket and some NP-G2-029-interacting residues on fascin are shown.
