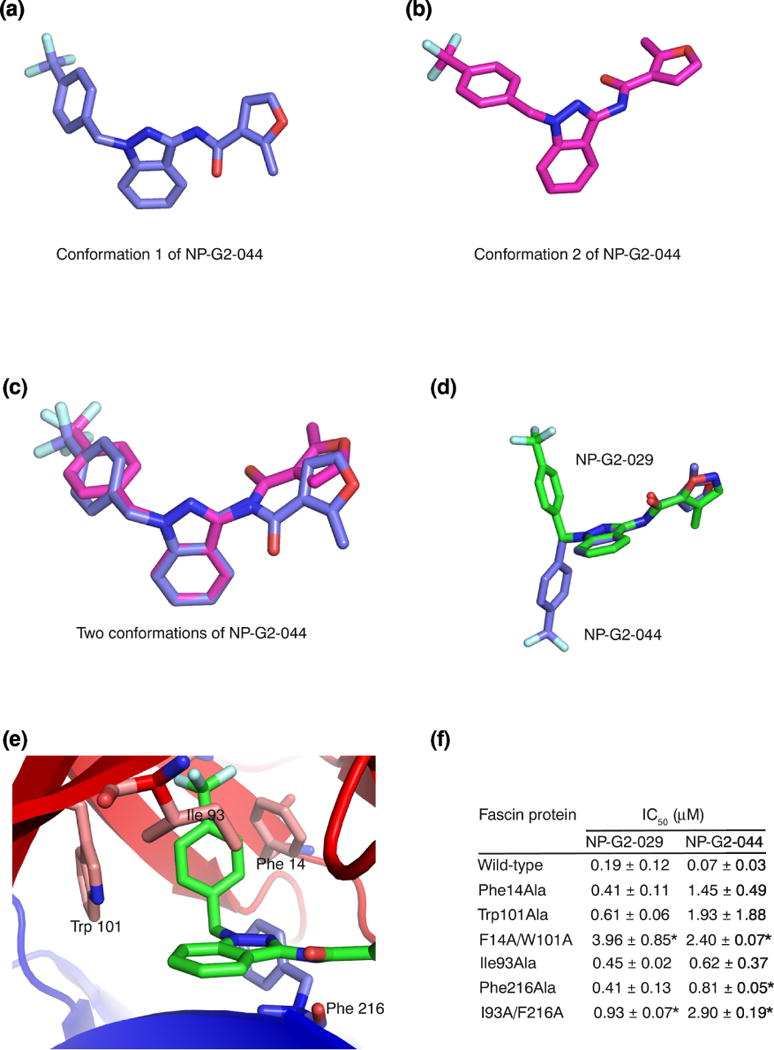
Figure 5.

Fascin induces a conformational change on the small-molecule inhibitor. (a) X-ray crystal structure of one conformation of NP-G2-044. (b) X-ray crystal structure of the second conformation of NP-G2-044. (c) Superposition of the two conformations of NP-G2-044. (d) Superposition of one conformation of NP-G2-044 and the NP-G2-029 structure when it is bound to fascin. (e). Diagram shows the positions of Phe14, Trp101, Ile93 and Phe216 residues which are involved in the inhibitor binding. (f) Summary of the actin-bundling data of wild-type and mutant fascin proteins in the presence of various concentrations of NP-G2-029 or NP-G2-044. The IC50 values are the mean of three repeats. Data are expressed as mean ± SD and analyzed by Student’s t test with significance defined as p < 0.05. * marks the mutants, when compared with the wild-type, with p < 0.05.
