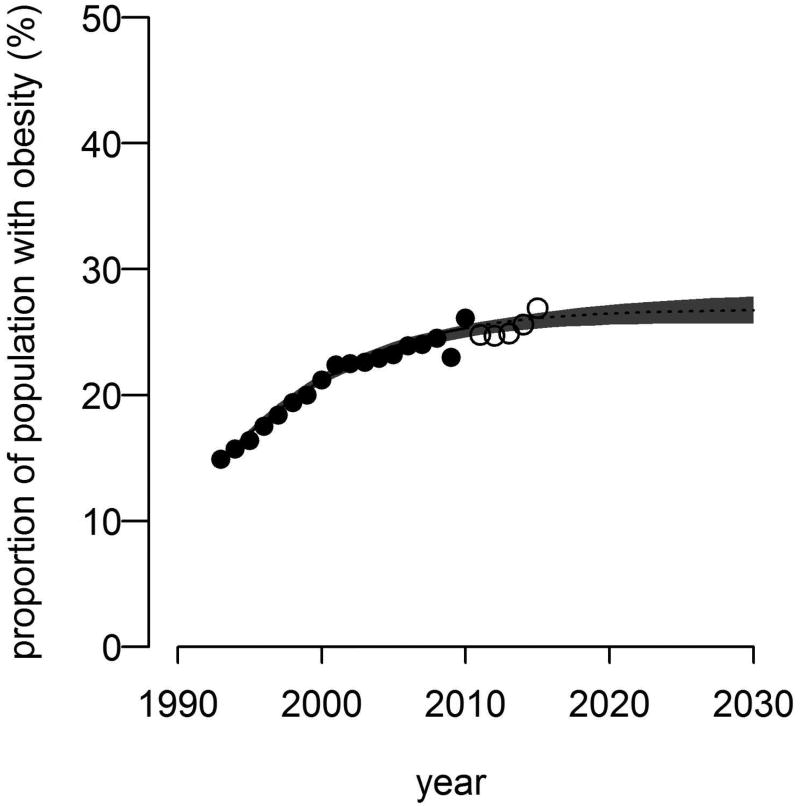
Figure 3. Obesity prevalence and genotype distribution from 1991 to 2030 in the UK.
Obesity prevalence. The dots show the obesity prevalence from the Health Survey for England, and the line is the fitted curve realized by the parameters estimated by the shooting method21. The grey area shows the 95% confidence interval of the prediction. The closed circles show the data used for the parameter estimation (1993–2010) and open circles (2011– 2015) are plotted for the purpose of model validation.

