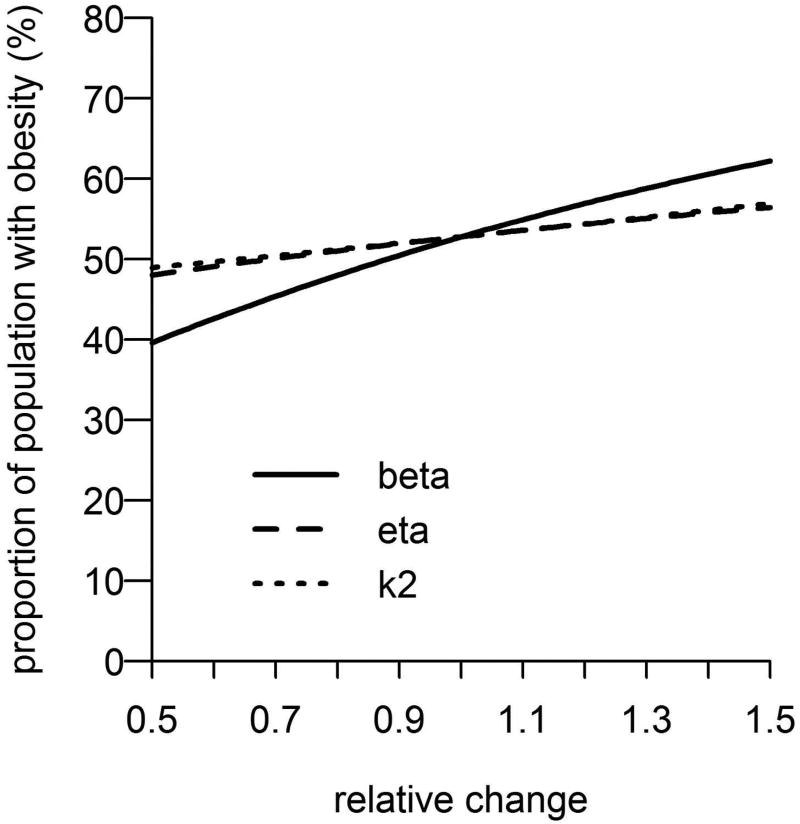
Figure 5. Converged obesity prevalence varying controllable parameters.
Each line corresponds to the converged obesity prevalence relatively magnifying (or reducing) coefficient for the transition rate due to social contagious weight gain risk (β), the transition rate due to spontaneous weight gain risk (η), and phenotypic transmission risk (k2) from the estimated values, respectively.

