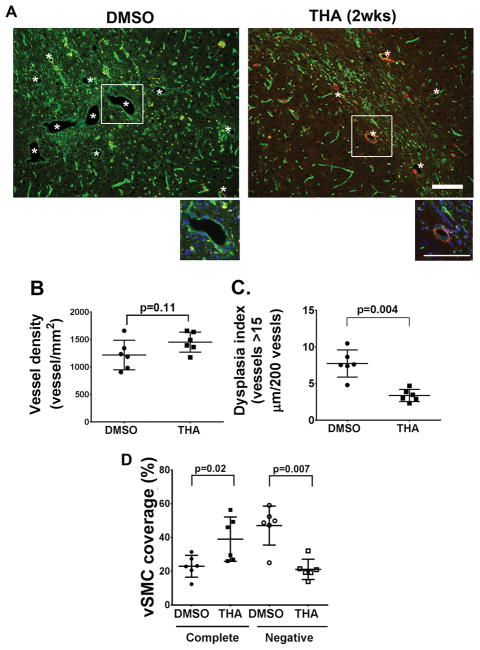
Figure 1. Thalidomide inhibits bAVM development.
A. Representative images of brain sections. Vessels were stained by lectin (green). Vascular smooth muscles were stained with an antibody against α-smooth muscle actin (red). *: indicates dysplastic vessels. The enlarged images of white rectangle areas are shown below the pictures. Scale bars: 100 μm. B. Quantification of vessel density. P=0.11, by t-test analysis. C. Dysplasia index (numbers of vessels that are larger than 15 μm in diameter per 200 vessels). P=0.004, by t-test analysis. D. Quantification of vSMC coverage. The data are the percentage of dysplastic vessels that were covered (Complete) or not covered (Negative) by vSMCs. THA (2wks): mice received thalidomide treatment starting 2 weeks after model induction. P values were determined by one-way ANOVA followed by Sidak’s multiple comparisons. N=6 for all analyses.

