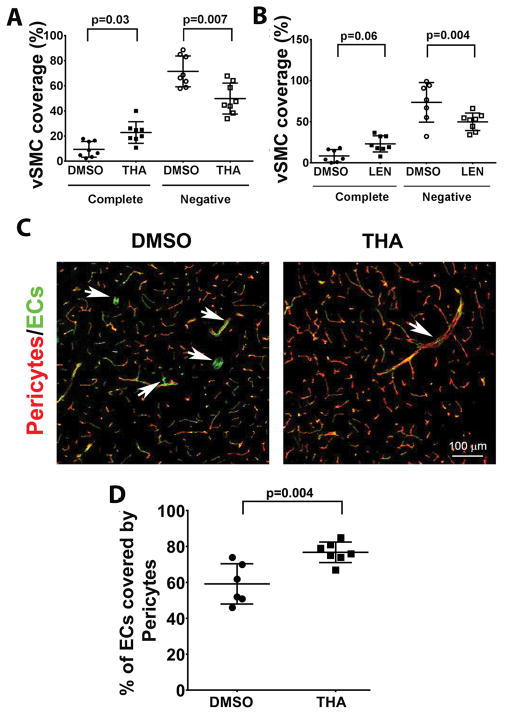
Figure 2. Thalidomide and lenalidomide increase mural cell-coverage in established bAVMs.
A & B. Quantification of vSMC (α-smooth muscle actin positive cells)-coverage. The data are the percentage of dysplastic vessels that were covered (complete) or not covered (Negative) vSMCs. N=8 for thalidomide (THA) treated group and its DMSO control. N=8 for lenalidomide (LEN) treated group and N=7 for its DMSO control. P values were determined by one-way ANOVA followed by Sidak’s multiple comparisons. C. Representative confocal images of brain sections stained with antibodies specific to endothelial cells (CD31, green) and pericytes (CD13, red). Arrows indicate pericyte negative vessel segments. Scale bars: 100 μm. D. Quantification of the percentage of endothelial cells (ECs) covered by pericytes. N=7 for thalidomide (THA) treated group and N=6 for its DMSO control. P=0.004, which was determined by one-way ANOVA followed by Sidak’s multiple comparisons. 8wks: treatments starting 8 weeks after model induction.

