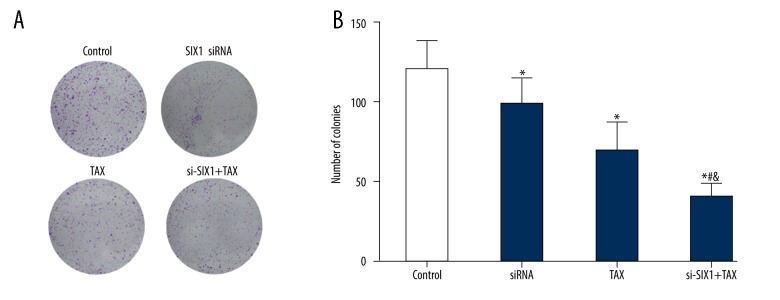
Figure 3.
SIX1 siRNA and/or TAX treatment reduced HepG2 clone formation. (A) Colony formation results display the colony formation of HepG2 cells in different groups. (B) Column diagram showing the colony formation results of HepG2 cells in different groups. Colony formation assay results showed that SIX1 siRNA, TAX, and si-SIX1+TAX group cells had fewer colonies than control cells. Moreover, si-SIX1+TAX group cells showed a significantly smaller number of colonies than SIX1 siRNA group and TAX group cells; * p < 0.05 compared with control group, # p<0.05 compared with SIX1 siRNA group, & p<0.05 compared with TAX group.

