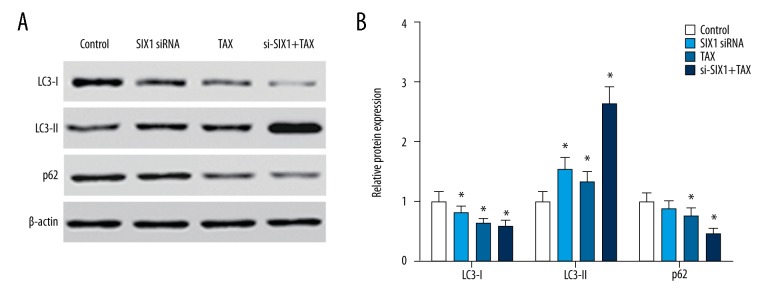
Figure 6.
SIX1 siRNA or/and TAX treatment significantly activated cell autophagy in HepG2 cells. (A) Results of western blot showing the expression of LC3-I, LC3-II, and p62 in HepG2 cells of different groups. (B) Grouped column diagram showing the relative autophagy-related protein expression level in HepG2 cells of different groups. After the interference of SIX1 expression or/and TAX treatment, the expression of LC3-I in HepG2 cells decreased and the expression of LC3-II increased significantly, whereas the expression level of p62 significantly decreased in cells treated with TAX and si-SIX1+TAX; * p<0.05 compared with control group.

