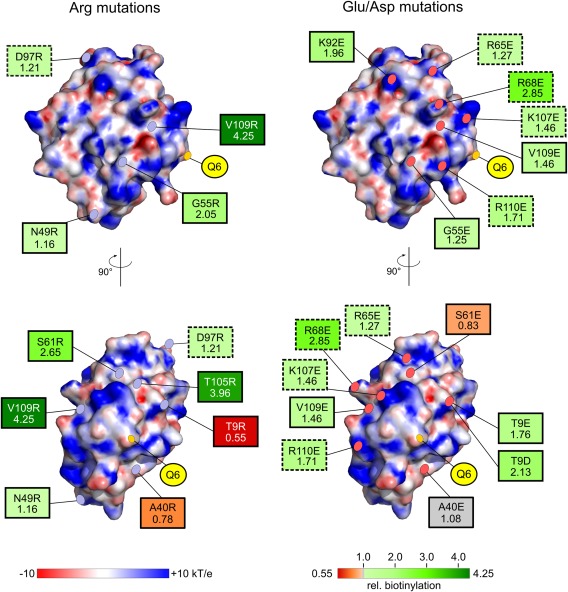
Figure 4.

Summary of the mutational studies of SPIp surface residues to influence MTG‐mediated biotinylation. Positions of mutations (with rel. biotinylation rate, see also Table II) are marked and labeled on the electrostatic surface of SPIp (–10 to +10 kT/e). Arg‐substitutions are shown on the left‐hand side and Glu/Asp mutations on the right‐hand side. Effect on the relative biotinylation rate of SPIp by MTG is indicated by a red to green color gradient with the variant resulting in the lowest rate colored in dark red (A40R = 0.55) and the variant with the highest rate colored in dark green (V109R = 4.25). Relative biotinylation rate of wtSPIp was set to 1.00 and is indicated in gray, as well as the A40E mutant with a rel. biotinylation rate of 1.08. Charge inversions (e.g., Arg to Asp) are marked with dashed borders and uncharged to charged substitutions are indicated by solid borders.
