. 2018 Feb 20;9(12):3192–3199. doi: 10.1039/c7sc04698g

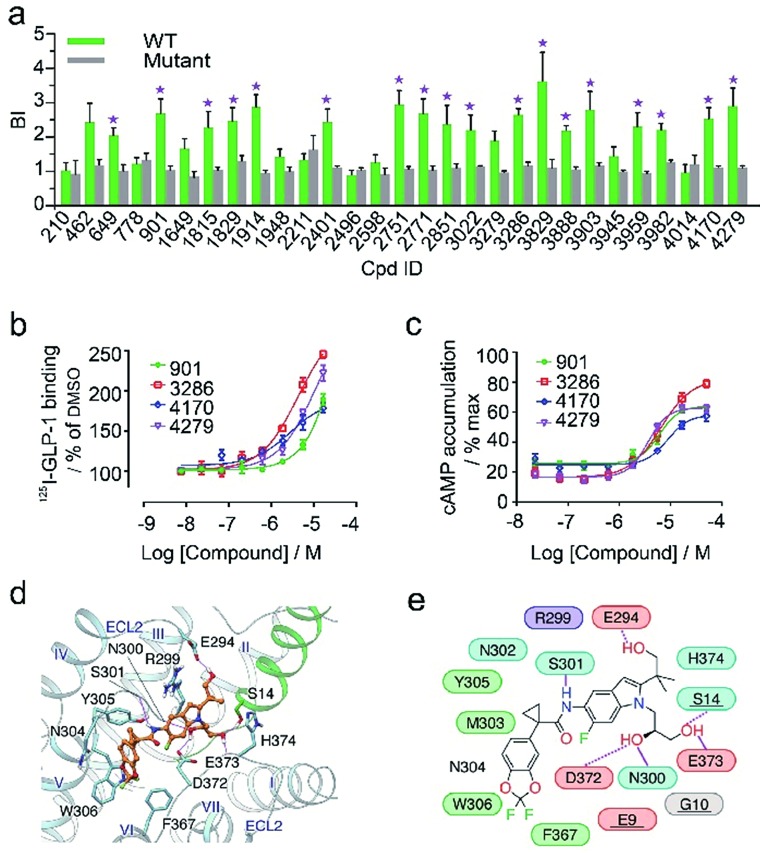
Fig. 5. (a) Affinity MS assay on a mixture of 29 initial hits using wild-type (WT) receptor-expressing membranes or point-mutated receptor-expressing membranes. Confirmed ligands (mean BI > 2 and p < 0.01) are designated by asterisks with data shown as mean and s.d. of four individual assays. (b) Affinity of each test ligand to GLP-1R determined by radioactive GLP-1 binding assay. (c) Enhanced GLP-1R cell activity in the presence of GLP-1 (0.02 nM) by each test ligand. pEC50 measurement for (b) and (c) is provided in Table S5. (d) Docked pose for 3286 (orange) in the GLP-1 (green)/GLP-1R (light blue) complex model. (e) Schematic representation of interactions between 3286 and GLP-1R. Residues of GLP-1 are underlined. Color codes for residues and interactions are as in Fig. 3e. While the predicted binding site is formed by extracellular loop 2 (ECL2), extracellular loop 3 (ECL3), transmembrane helix VI and GPL-1, 3268 seems to strengthen the interactions between ECL2, ECL3 and GLP-1, which may explain its PAM activity in the presence of GLP-1.

Fig. 5