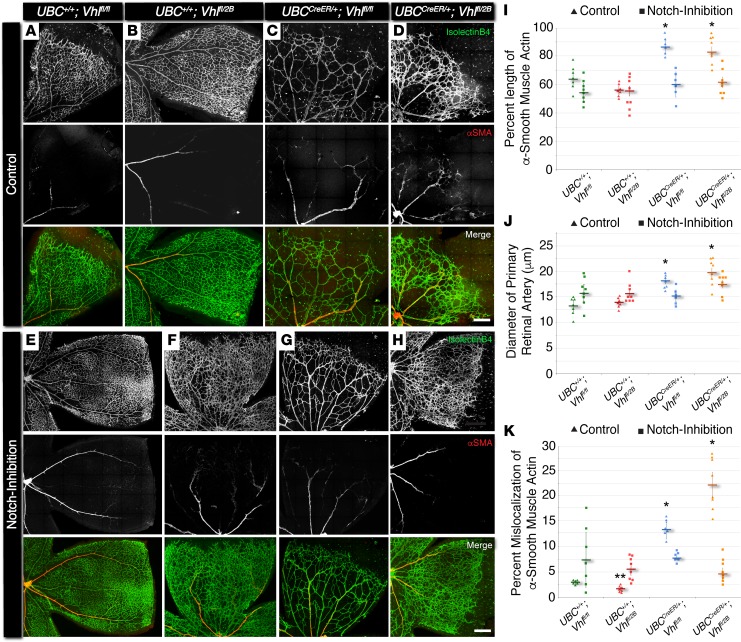
Figure 3. In P7 mouse retina, conditional Vhl-null and –type 2B mutations accelerate vessel maturation via excess alpha-smooth muscle actin expression, and this defect can be rescued by blocking Notch signaling.
(A–H) Representative images of P7 mouse retinal vasculature stained with isolectin B4 (top rows) and αSMA (middle rows). A quarter region, or leaflet, is shown for UBC+/+Vhlfl/fl, UBC+/+Vhlfl/2B, UBCCreER/+Vhlfl/fl, and UBCCreER/+Vhlfl/2B littermate retinas exposed to tamoxifen and subjected to either control treatment (DMSO, A–D) or Notch inhibition (DAPT, E–H). Scale bars: 200 μm. (I) Percent length of primary artery covered by αSMA+ cells in control (triangles) and Notch-inhibited (squares) P7 vascular networks. *P ≤ 0.05 vs. control UBC+/+Vhlfl/fl and UBC+/+Vhlfl/2B, and vs. Notch-inhibited within same genotype. (J) Diameter of primary retinal artery measured from control (triangles) and Notch-inhibited (squares) P7 vascular networks. *P ≤ 0.05 vs. control UBC+/+Vhlfl/fl and UBC+/+Vhlfl/2B, and vs. Notch-inhibited within same genotype. (K) Percent mislocalization of αSMA expression not associated with primary retinal arteries in control (triangles) and Notch-inhibited (squares) retinas. *P ≤ 0.05 vs. control UBC+/+Vhlfl/fl and UBC+/+Vhlfl/2B, and vs. Notch-inhibited within same genotype. **P ≤ 0.05 vs. control UBC+/+Vhlfl/fl, and vs. Notch-inhibited UBC+/+Vhlfl/2B. Values are averages ± SEM. n = 6–8 retina images per group (i.e., 3–4 from 2 experimental litters). All statistical comparisons performed using 1-way ANOVA followed by pair-wise comparisons with a 2-tailed Student t test.

