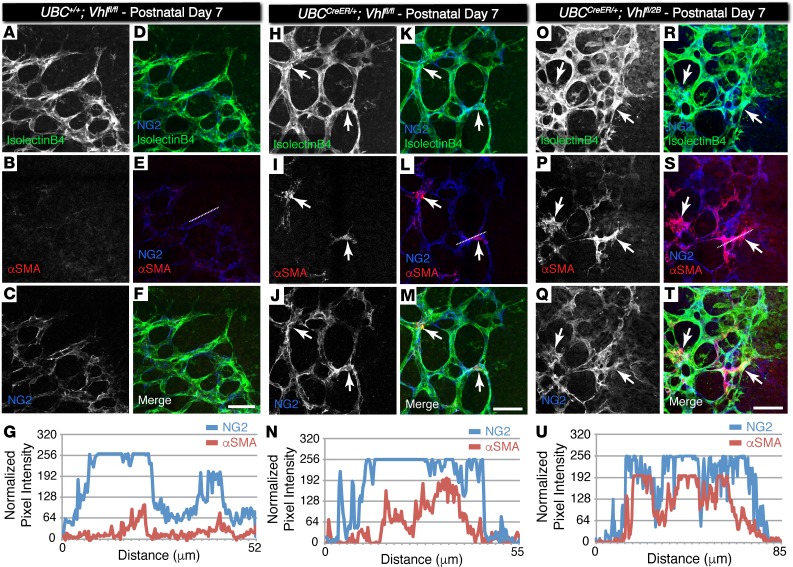
Figure 4. Pericytes at the vascular front of P7 conditional Vhl-null and Vhl type 2B mutant retina vessel networks ectopically express αSMA but not in littermate control vessels.
(A–F, H–M, O–T) Representative images of P7 mouse retinal vasculature stained for isolectin B4 (A, H, O), αSMA (B, I, P), and neural glial antigen-2 (NG2) (C, J, Q). The NG2 image is merged with the isolectin B4 image (D, K, R), with the αSMA image (E, L, S), and with both isolectin B4 and αSMA (F, M, T). Arrows indicate NG2+ cells overlapping with αSMA signal. The dotted lines in E, L, and S indicate the region of interest where pixel intensity values were measured and normalized. Scale bars: 50 μm. (G, N, U) Pixel intensity values for each line scan of NG2 and αSMA signals in the region indicated by the dotted line drawn in E, L, and S, respectively.

