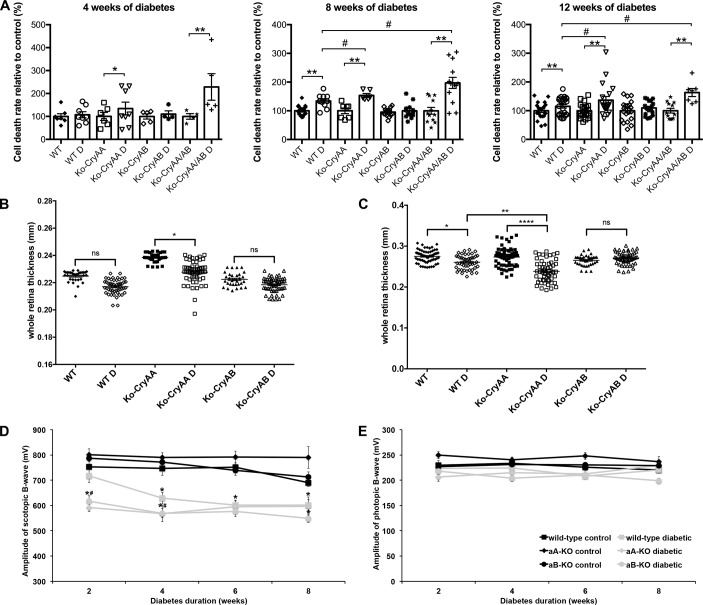
Figure 1. Retinal morphology and function of α-crystallin–KO mice.
Graphic representation of retinal cell death, measured by DNA fragmentation ELISA in whole retinas from WT, αA-crystallin–KO (Ko-CryAA), αB-crystallin–KO (Ko-CryAB), and double-KO (Ko-CryAA/AB) mice at 4, 8, and 12 weeks of diabetes (A). Retinal thickness was measured by optical coherence tomography (OCT) after 2 weeks (B) and by microscopy using histological sections after 4 weeks (C) of diabetes in the same experimental groups. Graphic representation of retinal function, assessed by electroretinogram (ERG) in the same animals, depicting the scotopic b-wave (D) and photopic b-wave amplitude (E) in diabetic WT (gray squares), αA-crystallin–KO (gray diamonds), and αB-crystallin–KO (gray circles) mice compared with nondiabetic controls (black labels) 2, 4, 6, and 8 weeks after diabetes induction. The combined rod-cone responses recorded at +1.09 log cd × s/m2 are reported. Early cataract formation precludes the use of OCT and ERG in double-KO mice. *P ≤ 0.05, **P ≤ 0.01, significantly different from nondiabetic WT mice. #P ≤ 0.05, significantly different from WT diabetic mice. For each time point, a minimum of 8 mice was used for each group reported. Statistical analysis was performed by 1-way ANOVA followed by Student-Newman-Keuls test. D, diabetic.

