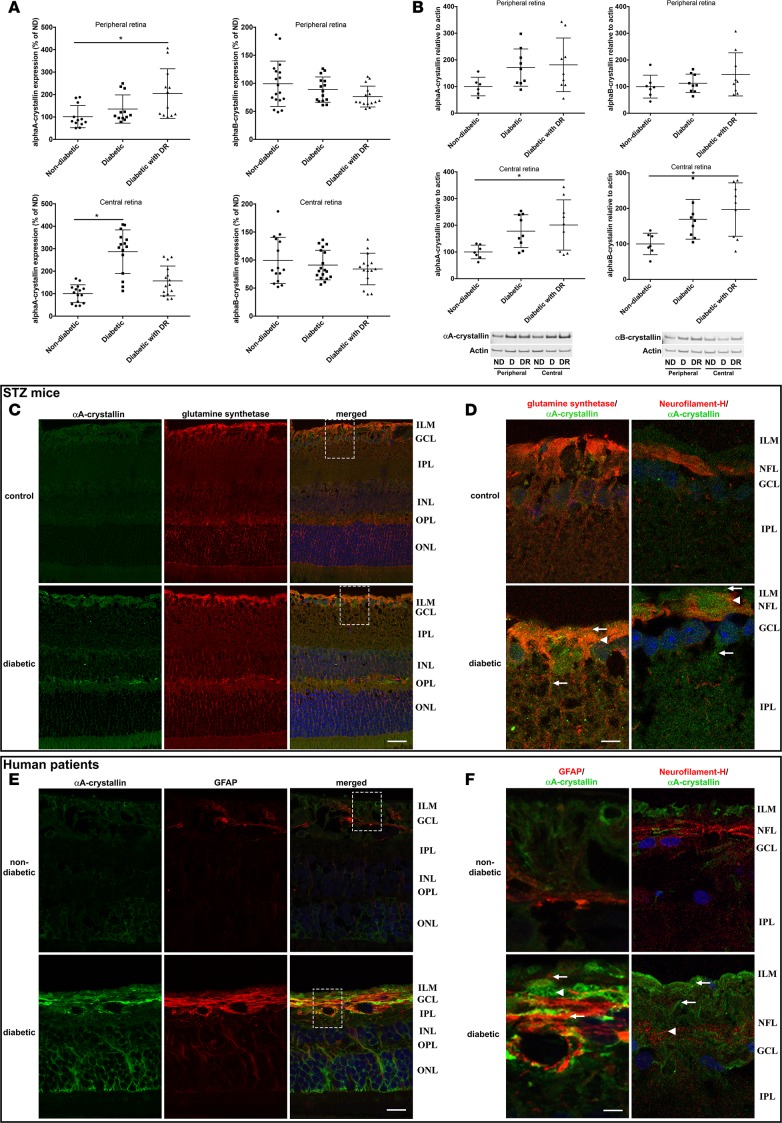
Figure 2. Cell-specific upregulation of α-crystallins in diabetic patients with and without diabetic retinopathy and in diabetic rodents.
The expression of α-crystallins in the central and peripheral regions of the retina of human donors was analyzed by quantitative real-time PCR (A), immunoblot (B), and immunohistochemistry (C–F). Graphic representations and representative Western blot images of α-crystallins levels in human donors, nondiabetic (ND; n = 7) or diabetic without retinopathy (D; n = 9) or with diabetic retinopathy (DR; n = 9), are shown. Crystallin expression is presented normalized to actin levels and relative to the expression in nondiabetic donors (*P ≤ 0.05, significantly different from nondiabetic donors). Statistical analysis was performed by 1-way ANOVA followed by Student-Newman-Keuls test. Cellular localization of αA-crystallin (green) was assessed by immunofluorescent staining on retinal cross-sections from nondiabetic control and diabetic WT mice (C and D; n = 6) and nondiabetic and diabetic donors with diabetic retinopathy (E and F; n = 4). Coimmunostaining with specific markers of Müller glial cells (glutamine synthetase, C and D, or glial fibrillary acidic protein [GFAP], E and F, red) and ganglion cells (neurofilament-H, D and F, red) reveals colocalization of αA-crystallins with Müller glial cells and partially with ganglion cells in diabetic animals (D) and human donors with DR (F). Nuclei were counterstained with Hoechst (blue). Higher-magnification images of relevant regions (marked by a dash square) show increased expression of αA-crystallins in Müller glial cells (arrows) and ganglion cells (arrowheads) during diabetes (scale bar: 20 μm [C and E]; 4 μm [D and F]). ILM, inner limiting membrane; GCL, ganglion cell layer; IPL, inner plexiform layer; INL, inner nuclear layer; OPL, outer plexiform layer; ONL, outer nuclear layer; NFL, nerve fiber layer.

