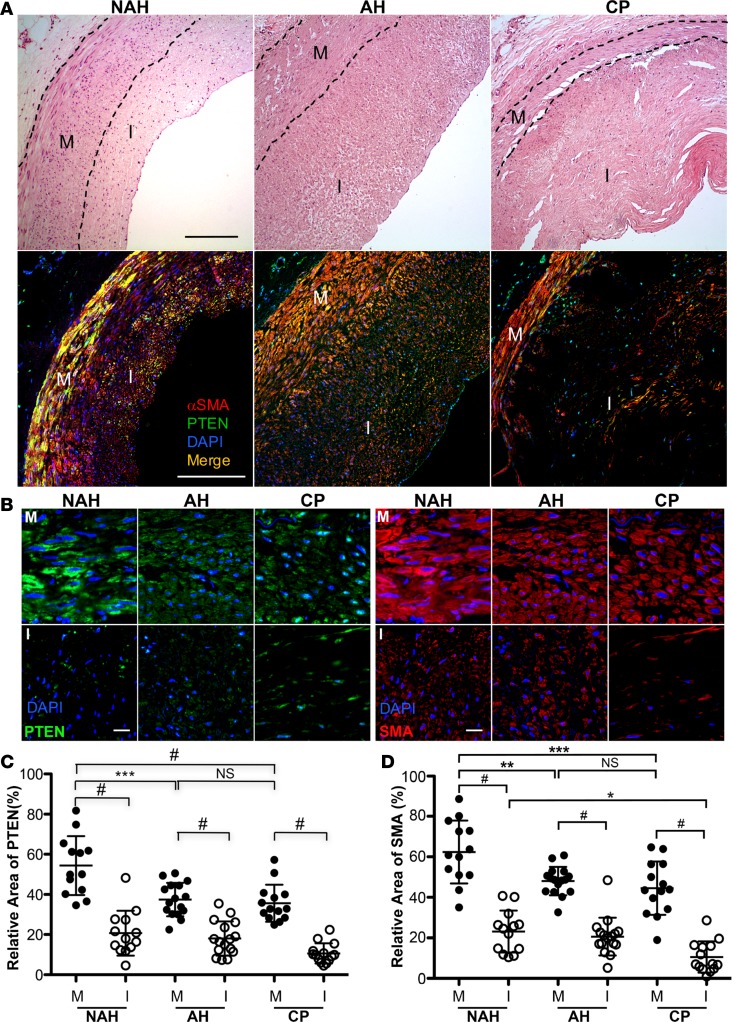
Figure 2. PTEN and α-smooth muscle actin (αSMA) expression in human atherosclerosis.
(A) Hematoxylin and eosin (H&E; top panels) and PTEN (green) and αSMA (red) stained confocal images (bottom panels) of lesions representing nonatherosclerotic hyperplasia (NAH), atherosclerotic hyperplasia (AH; intima > 200 μm), or complex plaque (CP). Black dashed lines delineate the arterial media (M). I = arterial intima. Scale bars: 200 μm. (B) PTEN (green; left) and αSMA (red; right) stained confocal images of NAH (left in each group), AH (middle in each group), and CP (right in each group) lesions. PTEN and αSMA levels are more abundant in medial (M) smooth muscle cells (SMCs) compared with intimal (I) SMCs and are decreased in atherosclerotic lesions (AH, CP) compared with NAH lesions. Scale bars: 25 μm. (C) Relative area of PTEN expression in the arterial media (M) or intima (I) for a vessel lesion was measured by ImageJ and averaged from 4 or 5 confocal images (original magnification, ×63) of media and intima per vessel. (D) Relative area of αSMA staining was determined by ImageJ as described in C. NAH: N = 13 individual vessels from 7 independent hearts; AH: N = 16 individual vessels from 10 independent hearts; CP: N = 14 individual vessels from 11 independent hearts. Horizontal lines represent the mean ± SD. *P ≤ 0.05, **P ≤ 0.01, ***P ≤ 0.001, #P ≤ 0.0001, by ANOVA with Bonferroni’s posttest multiple comparison test.

