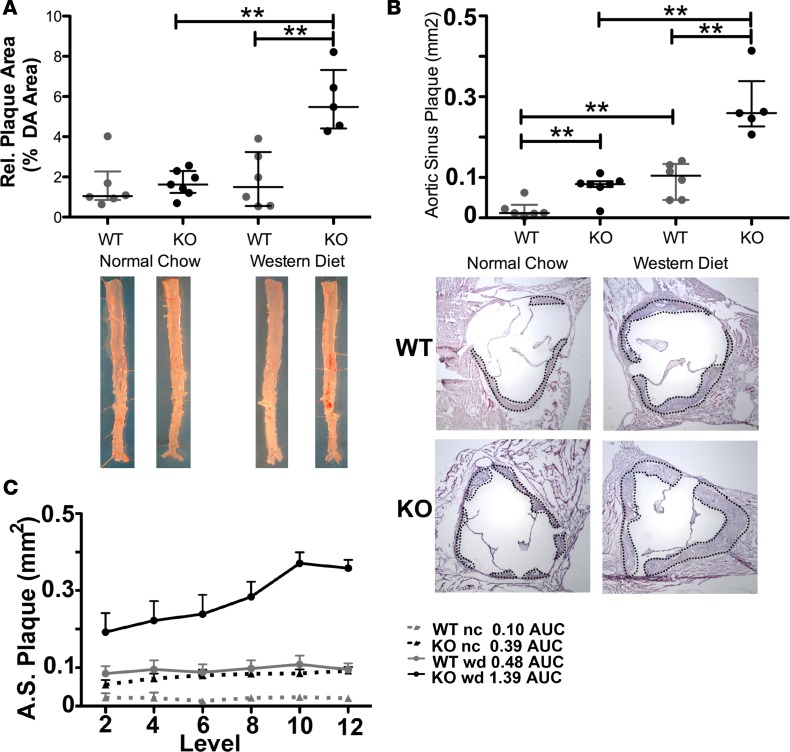
Figure 4. Accelerated atherosclerosis development in inducible, smooth muscle cell–specific PTEN-KO mice.
Myh11-CreERT2; ApoE–/– (WT) and PTEN-iKO; ApoE–/– (KO) mice were injected with tamoxifen. Two weeks after the last tamoxifen injection mice were placed on normal chow (nc) or Western diet (0.15% cholesterol; wd) for 8 weeks. N = 6 WT nc, WT wd, KO nc; N = 5 KO wd. (A) The amount of atherosclerotic plaque in the aorta was measured as the percentage area of Sudan IV+ (red) plaques per area of en face–mounted descending aorta (DA). Representative aortas from each genotype and diet cohort are shown (bottom). (B) The area of intimal plaques was measured at 6 equally spaced levels in the aortic sinus and averaged. The mean area (mm2) of the aortic sinus plaque is plotted for each mouse. Representative H&E images of the aortic sinus plaques in WT and KO mice are shown for groups fed the normal chow or Western-type diet (bottom); black dashed lines outline area of plaque. (C) Aortic sinus (A.S.) plaque areas are plotted at each section level to perform area under the curve (AUC) analysis, as a correlate of plaque size. For all panels, gray data points indicate WT samples, black data points indicate KO samples, and horizontal lines indicate the median and interquartile range. **P < 0.01 by Kruskal Wallis with Dunn’s posttest comparisons.

