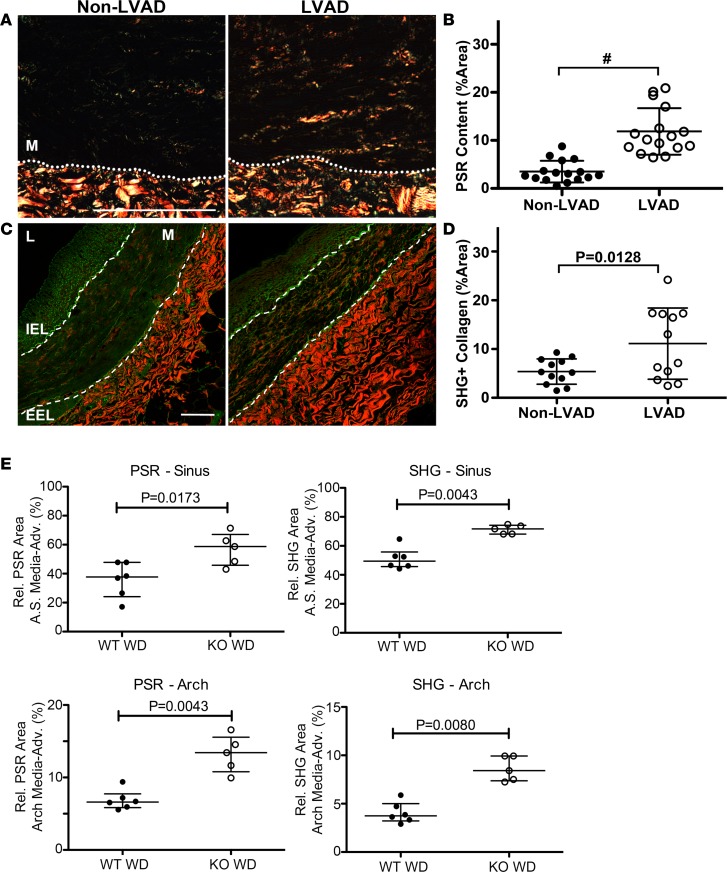
Figure 7. Increased collagen deposition in coronary arteries exposed to continuous-flow left ventricular assist devices (CF-LVADs).
(A) Representative polarized light microscopy images of coronary arteries from explanted hearts of non-LVAD (left) or CF-LVAD (right) patients stained with picrosirius red (PSR) to quantify collagen deposition. Dashed lines separate the arterial media (M) from underlying adventitia. Scale bar: 100 μm. (B) Percentage PSR-positive area in the arterial media was measured by ImageJ and averaged from 4 or 5 images (original magnification, ×4) per vessel. non-LVAD: N = 16 individual vessels from 10 independent hearts; CF-LVAD: N = 16 individual vessels from 9 independent hearts. #P ≤ 0.0001. (C) Representative images of coronary arteries from explanted hearts of non-LVAD (left) or CF-LVAD (right) patients imaged using label-free second harmonic generation confocal microscopy (SHG). Dashed lines delineate the arterial media. M, arterial media; IEL, internal elastic lamina; EEL, external elastic lamina. Scale bar: 100 μm. (D) Percentage SHG-positive area in the arterial media was measured by ImageJ and averaged from 4 or 5 images (original magnification, ×20) per vessel. non-LVAD: N = 12 individual vessels from 8 independent hearts; CF-LVAD: N = 12 individual vessels from 8 independent hearts. Horizontal lines indicate the mean ± SD. #P ≤ 0.0001 by 2-tailed Student’s t test. (E) Sections of aortic sinus (top graphs) and aortic arch (bottom graphs) of tamoxifen-treated WT and PTEN-iKO mice placed on high-fat diet (WD), as described in Figure 4, were stained and imaged for PSR (left graphs) or processed and imaged for SHG microscopy (right graphs). Percentage PSR-positive or SHG-positive area in the combined media and adventitia was measured as described above. N = 6 WT WD, N = 5 KO WD. Horizontal lines show the median ± interquartile range. P values determined by 2-tailed Mann-Whitney t test.

