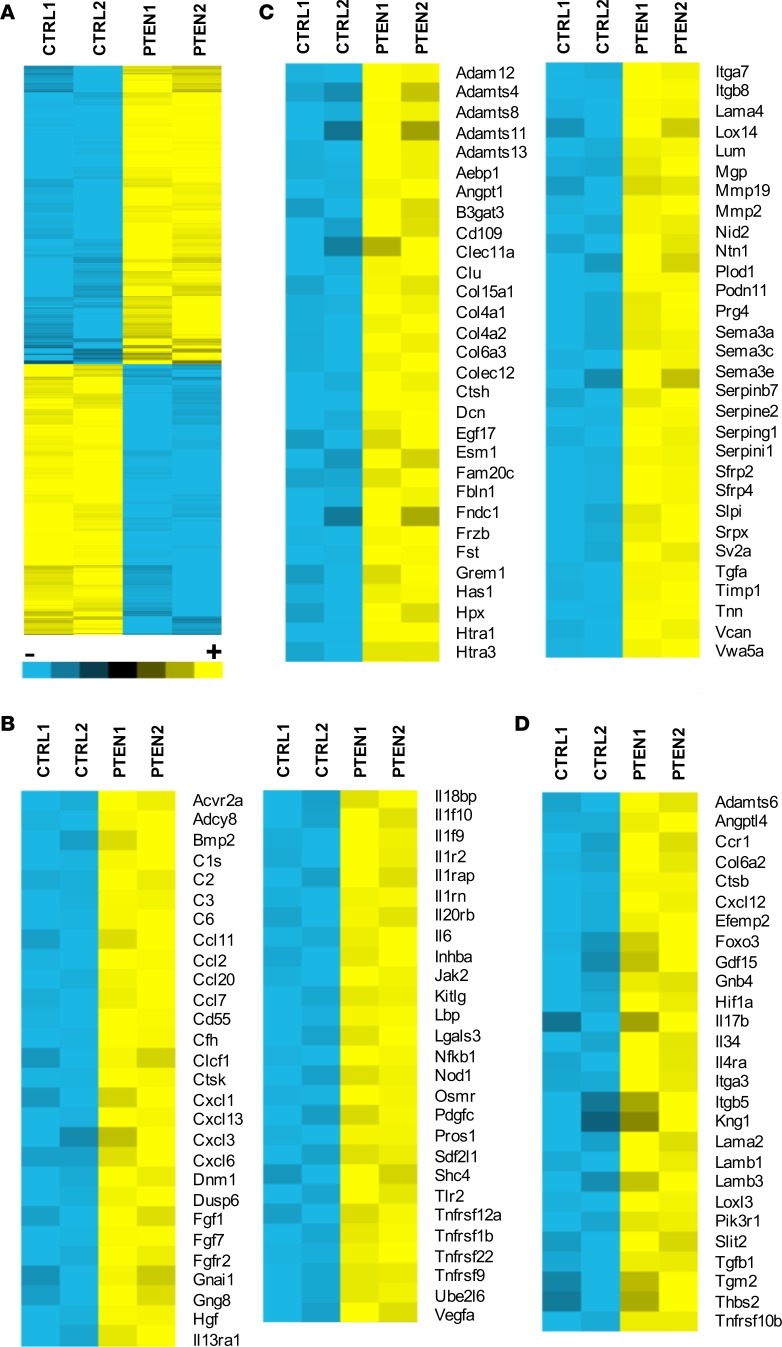
Figure 8. Loss of PTEN in smooth muscle cells (SMCs) promotes a proinflammatory, profibrotic phenotype.
Control (CTRL1/2) or PTEN-deficient (PTEN1/2) SMCs were growth-arrested in media containing 0.1% calf serum for 48 hours. Total RNA was isolated from replicates and microarray analysis was performed using the Affymetrix RAE-230 rat Genechip. (A) Heatmap representing 1,173 differentially expressed genes. Yellow represents upregulated genes (591 genes upregulated in PTEN-deficient SMCs); blue represents downregulated genes (547 genes downregulated in PTEN-deficient SMCs). (B) The 1,173 differentially expressed genes were compared to previously published datasets of chemokine- and cytokine-associated genes. Heatmaps represent 55 genes that are upregulated in PTEN-deficient SMCs compared with control SMCs. (C) The 1,173 differentially expressed genes were compared to previously published datasets of extracellular matrix–associated (ECM-associated) and ECM remodeling–associated genes. Heatmaps represent 62 genes that are upregulated in PTEN-deficient SMCs compared with control SMCs. (D) Differentially expressed genes were compared to previously published cytokine and ECM datasets described above. Heatmap represents 27 genes that are upregulated 1.8- to 2.0-fold in PTEN-deficient SMCs compared with control SMCs.

