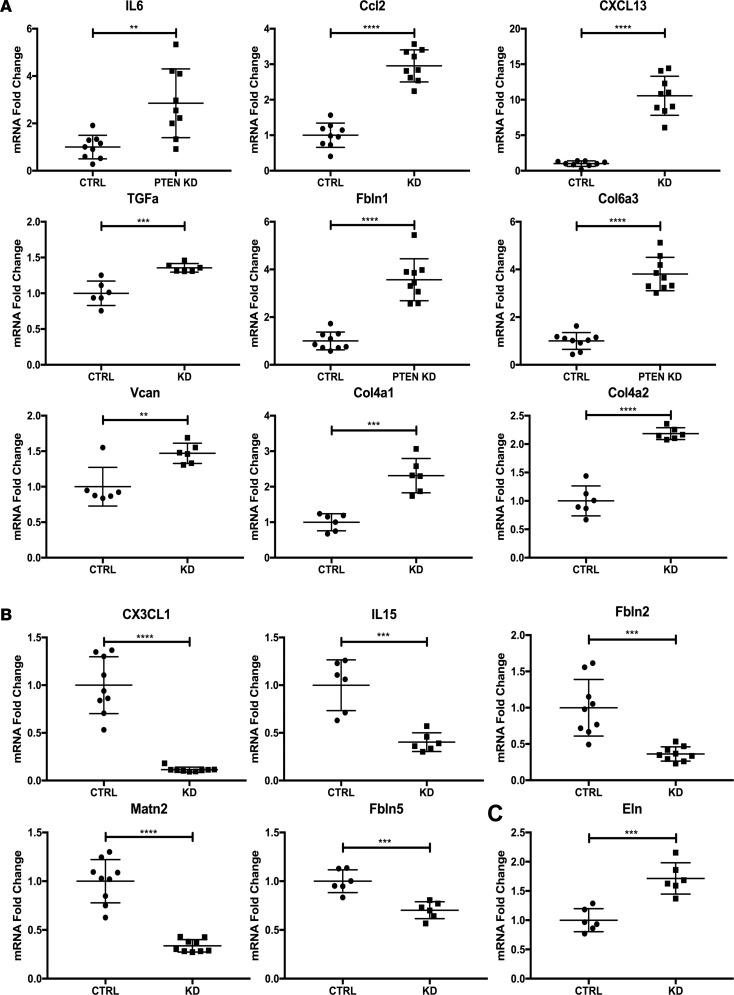
Figure 9. qPCR validation of gene changes in PTEN-deficient smooth muscle cells (SMCs) compared with control SMCs.
Control (CTRL) or PTEN-deficient (PTEN KD) SMCs were growth-arrested in media containing 0.1% calf serum for 48 hours. Total RNA was isolated and quantitative RT-PCR (qPCR) was used to analyze for the indicated mRNAs. Horizontal lines indicate the mean ± SD. Shown are fold changes in mRNA copy number from triplicates or replicates of N = 3 independent experiments.**P < 0.01, ***P < 0.001, ****P < 0.0001 by 2-tailed Student’s t test. GAPDH was used for normalization. (A) Upregulated genes in PTEN-deficient SMCs compared with controls. (B) Downregulated genes in PTEN-deficient SMCs compared with controls. (C) mRNA that did not track with the microarray data.

