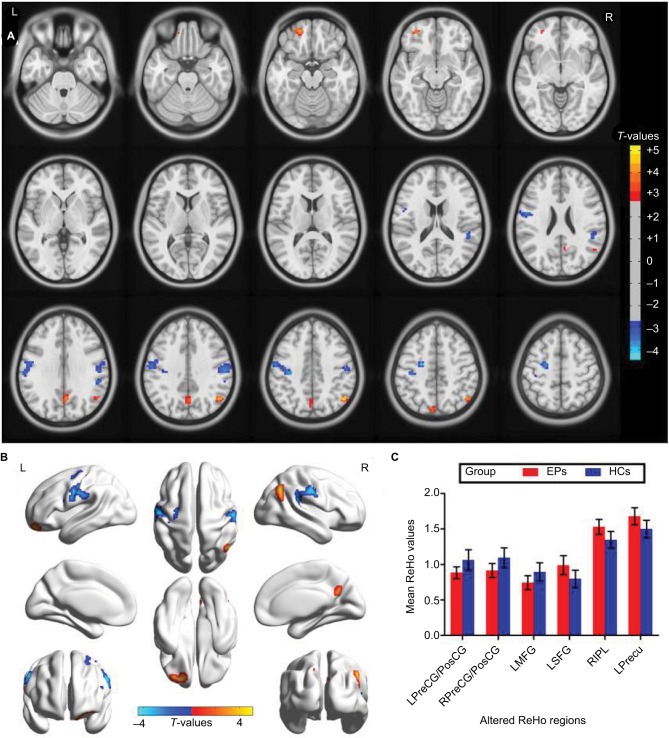
Figure 1.
Spontaneous brain activity in the EPs versus HCs. (A and B) Significant activity differences were observed in the left precentral/postcentral gyrus (BA3/4), right precentral/postcentral gyrus (BA3/4), left middle frontal gyrus (BA6), left superior frontal gyrus (BA11), right inferior parietal lobule (BA39/40), and left precuneus (BA7). The red or yellow denotes higher ReHo values, and the blue areas indicate lower ReHo values (P<0.01 for multiple comparisons using Gaussian Random Field theory (z>2.3, P<0.01, cluster >40 voxels, AlphaSim corrected corrected). (C) The mean values of altered ReHo values between the EPs and HC groups.
Abbreviations: ReHo, regional homogeneity; EP, eye pain; HCs, healthy controls; PreCG/PosCG, precentral/postcentral gyrus; MFG, middle frontal gyrus; SFG, superior frontal gyrus; IPL, inferior parietal lobule; Precu, precuneus; L, left; R, right; BA, Brodmann area.

