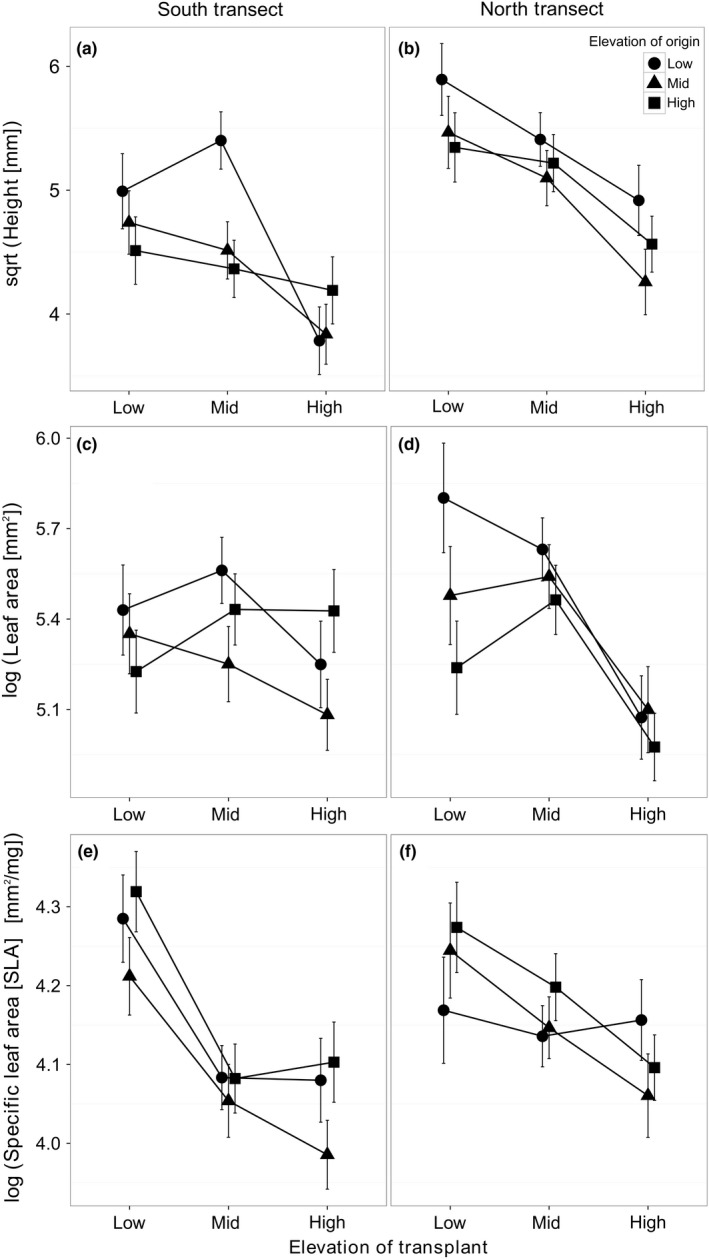
Figure 2.

Variation in three traits (a, b: height; c, d: leaf area; and e, f: specific leaf area) among Oxalis montana populations originating from three different elevations (low, mid, and high) and transplanted to each of these elevations, within each of two transects (columns). Dots represent least squares means of transformed population mean trait values, accounting for initial biomass, with symbols identifying elevations of origin. Standard errors are presented for each mean
