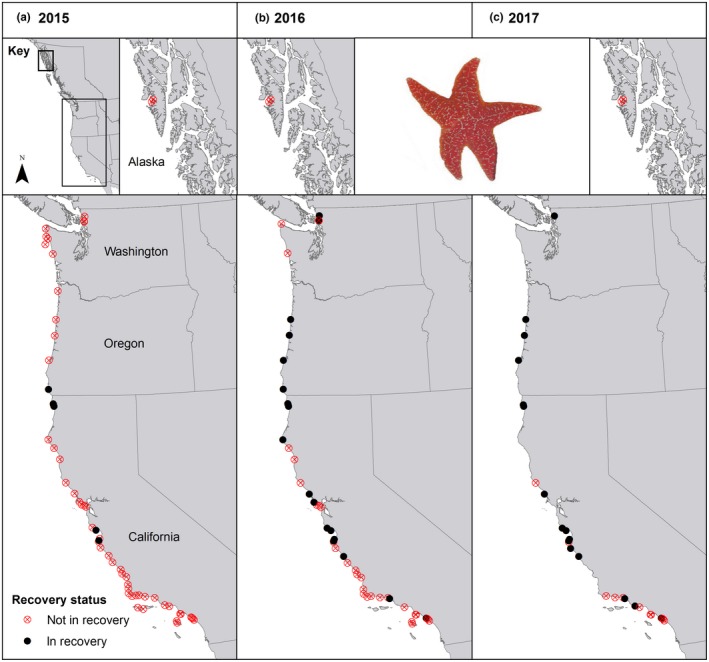
Figure 2.

Map of sites that have begun population recovery in (a) 2015, (b) 2016, and (c) 2017. Closed black circles represent sites with post‐SSWS‐born Pisaster ochraceus present. Open red circles with an “x” represent sites with no post‐SSWS‐born P. ochraceus present
