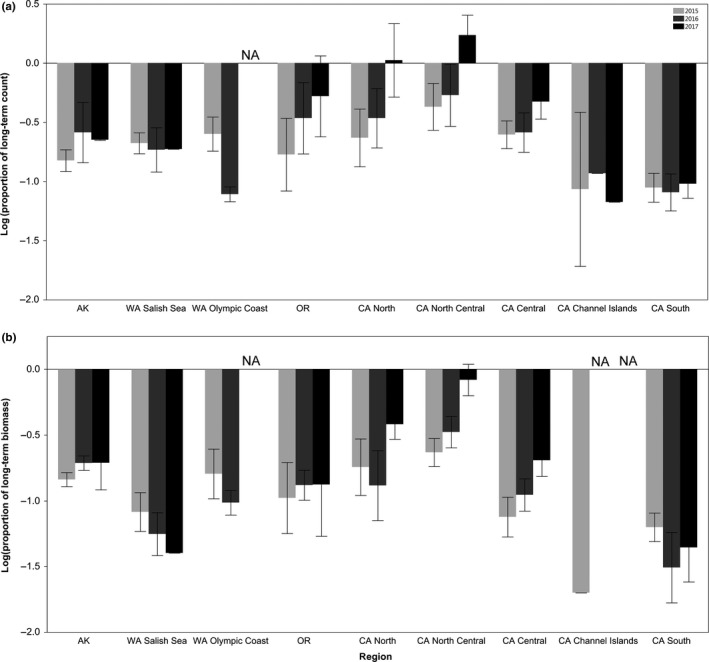
Figure 3.

Regional means of (a) log‐transformed counts and (b) log‐transformed biomass of Pisaster ochraceus as the proportion of each site's pre‐SSWS mean. Light gray bars represent 2015, medium gray bars represent 2016, and black bars represent 2017. Error bars denote standard error. Sites sampled each year are described in Tables S1 and S3. In 2016 and 2017, all sites sampled in the CA Channel Islands region had either no pre‐SSWS size data or had counts of 0 individuals, preventing calculation of mean biomass
