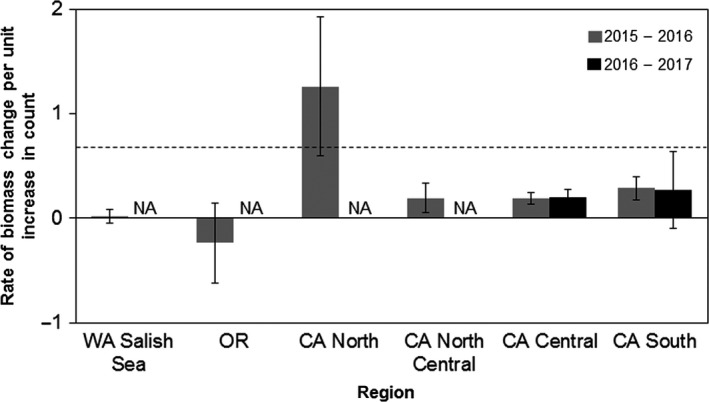
Figure 4.

Rate of change in relative biomass per unit increase in relative counts. The height of the bar represents the slope of the linear regression between change in proportion of pre‐SSWS count and change in proportion of pre‐SSWS biomass between two consecutive years. Only regions with enough sites (n ≥ 4) in consecutive years are shown. Dashed reference line at y = 0.67 represents the average slope of the linear regression between change in proportion of count and biomass at sites from 1989 to 2012
